Hail
The day after
When a hailstorm ends over the portfolio.
Measures the swath and calculates hectares and exposed sum insured by band, versioned: the day-one number is never corrected.
EmailExcelSigned PDF
Reinsurance and accumulation
As soon as the storm ends, Ucotron measures the swath and calculates the hectares and exposed sum insured of your portfolio by band. Versioned: if the figure changes, the revision arrives with its reason.
Hectares exposed after a hailstormDay 1
The usual number
12.000 ha
What was reported on day 1, with the first claims.
Ucotron's number
19.600 ha
v1Measured from the footprint on day 1, at 19:40.
Every new claim moves the usual number. Ucotron's comes from the storm, not from the claims.
Illustration of a typical case
What happens today
First, 12,000 exposed hectares get reported.Then it's 20,000.
The number grows as claims come in. Today the swath is drawn by hand in the GIS and everyone waits for the claims to size the area and the exposed sum insured. And correcting a number already reported to the reinsurer is the hardest part.
It's reported with the first claims and corrected with every one that arrives.
The event becomes known through the news or the first claim, not through an alert.
“Maybe the job is designing what alerts me and what doesn't.”
The day after
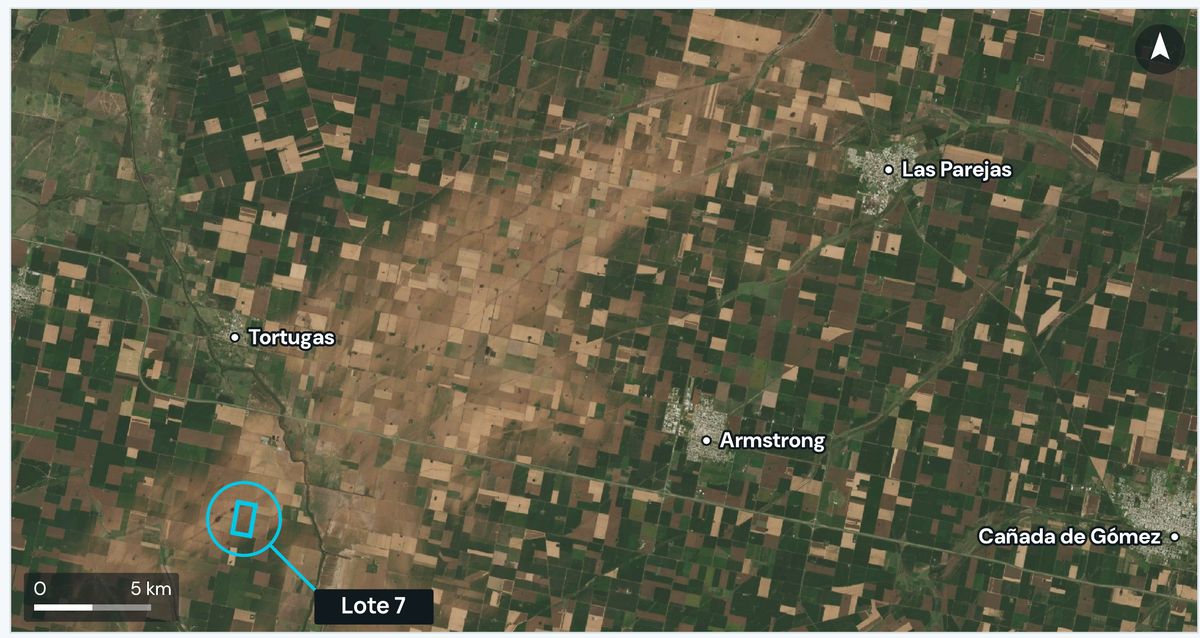 The hail swath
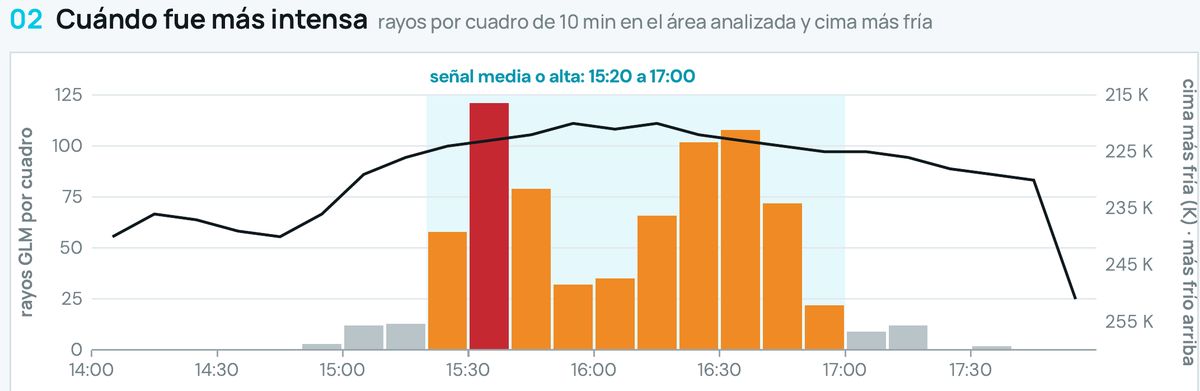 Peak: 121 flashes in 10 minutes
Hail on Sep 19, 2026 · Córdobav1
Demo portfolio · 60 homes
The swath in your GIS
If you'd rather not share the portfolio, the swath arrives as a layer to overlay in your own GIS. You calculate hectares and exposed sum insured yourself, with your fields, and compare it to what you reported.
swath-v1.geojson
Your portfolio, on your server
What alerts and what doesn't
In a year with storms everywhere, what isn't significant goes unread. You choose the threshold: what arrives right away, what goes in the Monday digest, and what never reaches you.
The week across the portfolioSimulation
Accumulation and scenarios
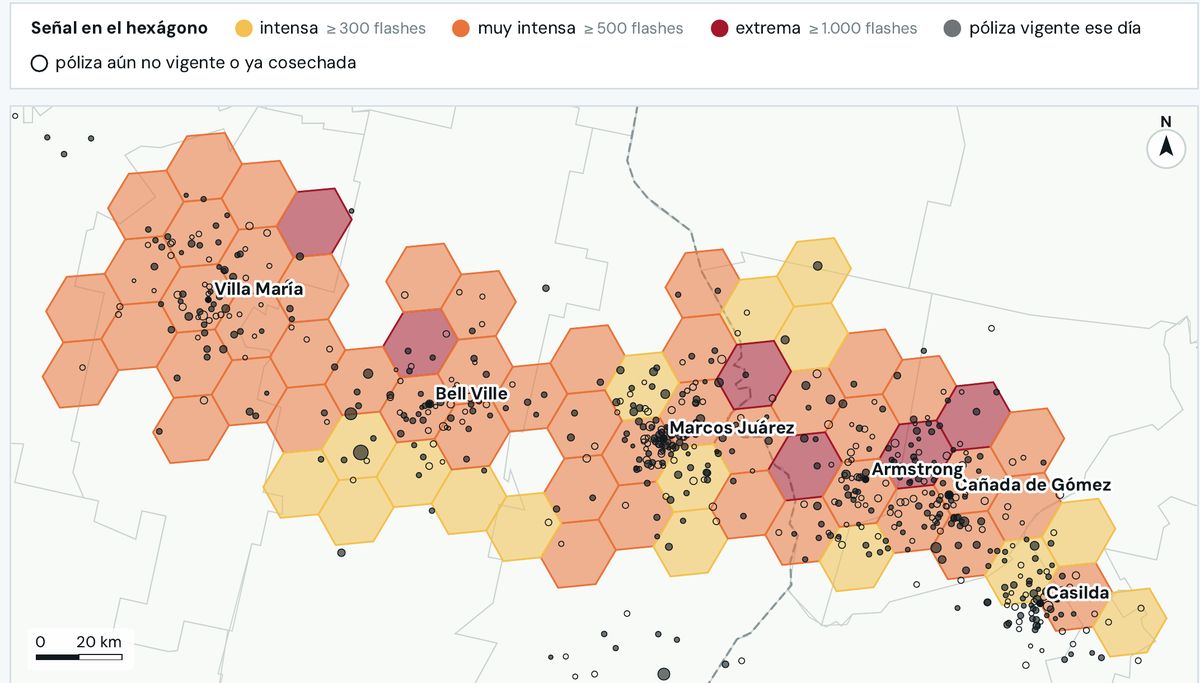
The strong storms since satellite lightning data began, carried over to today's portfolio. Pick one, shift the footprint, and see how much exposed sum insured sits underneath. It's exposed sum insured, not loss.
Less sumMore sum insured per hexagon
IntenseVery intenseExtreme
This is how the portfolio's sum insured is distributed. Pick a storm to carry it over.
Demo portfolio · simplified footprints · exposed sum insured, not loss
The notice to the reinsurer
When the footprint of a significant event closes, the recipe prepares the summary with its Excel file, the layer, and the signed report. Someone in reinsurance reviews it and forwards it. If the figure changes later, version 2 goes out with the reason.
ToYour reinsurer
SubjectHail on Sep 19, 2026 in Córdoba · version 1
Here is yesterday's event over the portfolio.
Storm of Sep 19, 2026, with medium or high signal between 15:20 and 17:00 and a peak of 121 flashes in 10 minutes at 15:30.
557 km² with medium or high signal. Of 60 homes, 2 are in high signal and 19 in medium.
This is version 1. If the figure changes, you'll receive version 2 with the reason.
| Band | Homes | Part of the portfolio |
|---|---|---|
| High signal | 2 | 3 % |
| Medium signal | 19 | 32 % |
| Low or outside | 39 | 65 % |
Approved by reinsurance
SendDemo portfolio · real storm
Reinsurance recipes
Hail
When a hailstorm ends over the portfolio.
Measures the swath and calculates hectares and exposed sum insured by band, versioned: the day-one number is never corrected.
EmailExcelSigned PDF
Hail
When a hailstorm is detected.
Delivers the footprint as a layer to overlay in your GIS, without sharing the portfolio.
GIS layer
Hail
When the footprint of a significant event closes.
Sends the event summary with its Excel, ready to forward.
EmailExcel
Hail
When the contract renewal is approaching.
Carries the worst storms of recent years over to today's portfolio and shows where it accumulates.
Signed PDFExcel
Various
On Mondays at 7:00.
Summarizes the week's events over the portfolio, by zone and by peril.
Start with the swath of one storm as a layer in your GIS, without your portfolio leaving your company.