Satellite infrastructure for insurance

Climate risk, end to end.

Hail, lightning, wind, flood, drought. Ucotron measures every climate event over every asset in your portfolio and turns it into underwriting, monitoring, claims and renewal decisions — with signed satellite evidence.

View map
Pampas · ARHigh risk
Cerrado · BRHigh hail prob.
Punjab · INNo radar coverage
Free State · ZAMedium risk
Poltava · UAActive monitoring
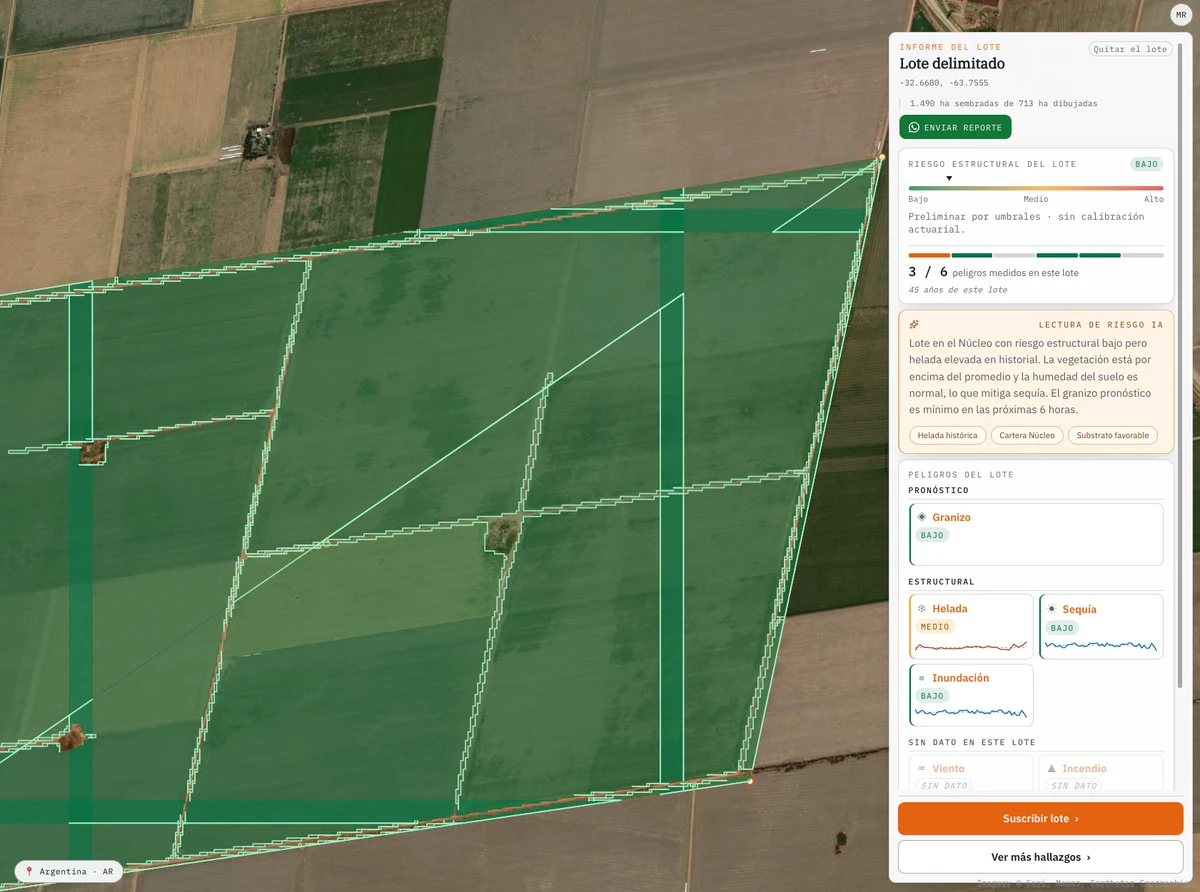
Satellite view of the farming areaThe platform watching the portfolio

Placeholder — replace with a real platform capture when available.

01 · Where the capital sits

Measuring has a cost. Not measuring has a bigger one.

Three places where money leaks, policy by policy.

01 · Risk selection

Whoever can tell a good risk apart takes the good ones.

Quoted risks · 40-year footprint

Price on the zone average and you inherit the book someone else turned down — at the same price.

02 · Claims assessment

A claim assessment that takes weeks today, in minutes.

Time
Field adjuster2–3 weeks
Ucotronminutes
Cost
Field adjuster$$$$
Ucotron$

And at a fraction of what sending an adjuster to the field costs.

03 · Accumulation

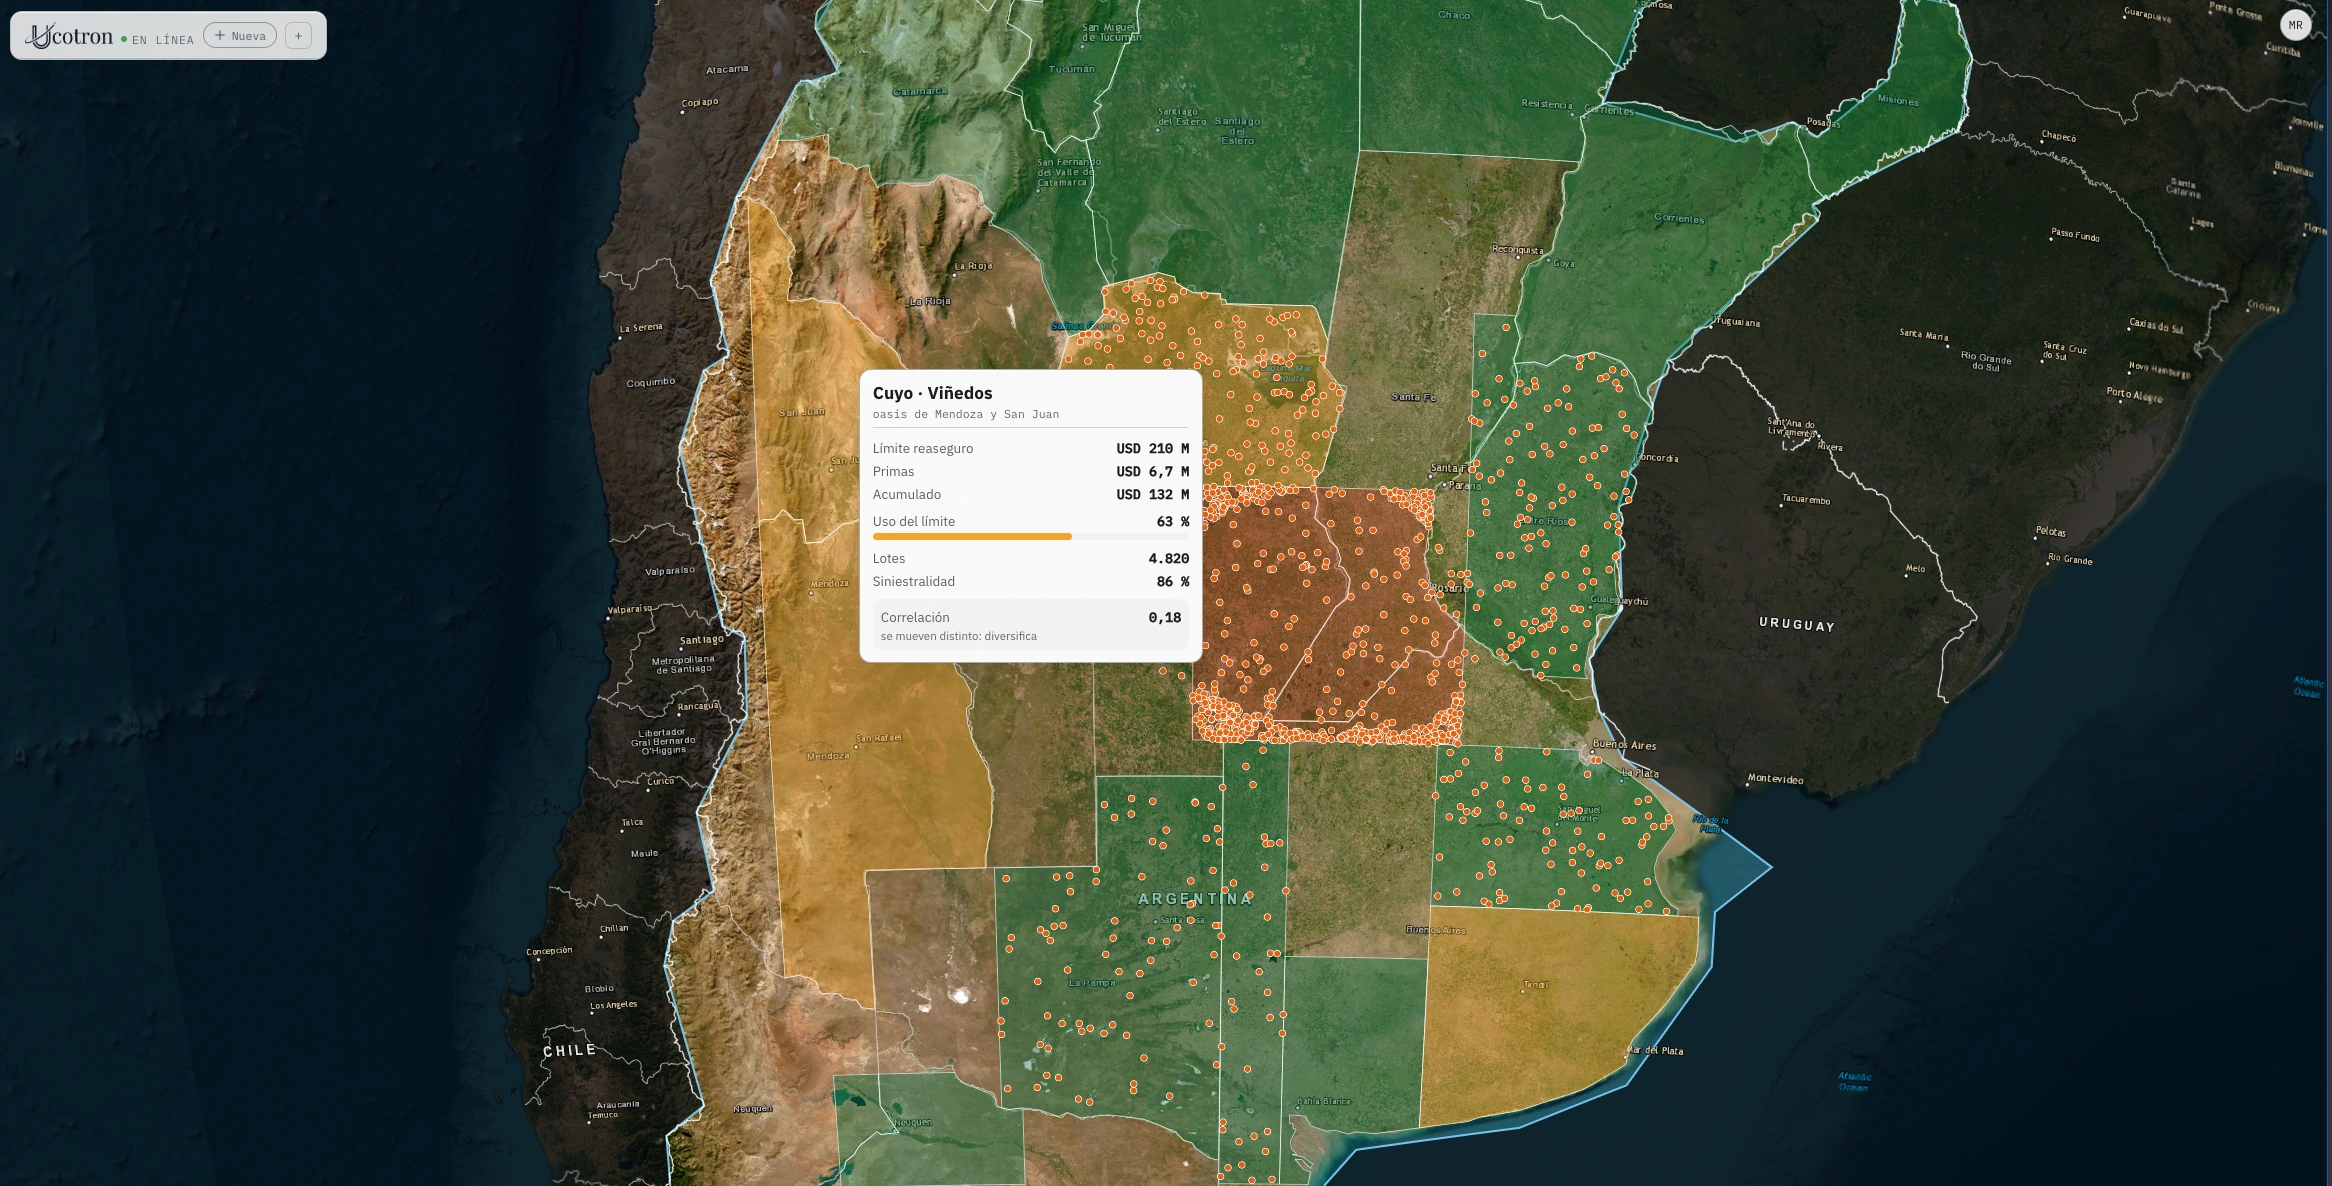
How much capital sits under a single footprint.

Policies under the event footprint

Characterise it better than your reinsurer's assumption and the cession gets cheaper.

02 · How Ucotron works

One engine. Every peril. The whole cycle.

The same engine answers for any climate event over any asset: in production today for hail, lightning and buildings; everything else comes online without changing platform.

From cloud to decision.

01 We predict

What may happen, and when.

02 We detect

What is happening, in real time.

03 We measure

What happened, with satellite evidence.

04 We model the impact

What it can cost you.

05 We help you decide

What to do about it.

The 5 use cases

Same weight. Different maturity.

Five questions the same engine already answers.

Agro claims

What happened to the crop, and why? Signed causal attribution, without sending an adjuster to the field.

What you get

Satellite delineation of the damage footprint, affected area and percentage per field, with the causal attribution of the event in a signed, auditable report.

Used in: Claims, Renewal
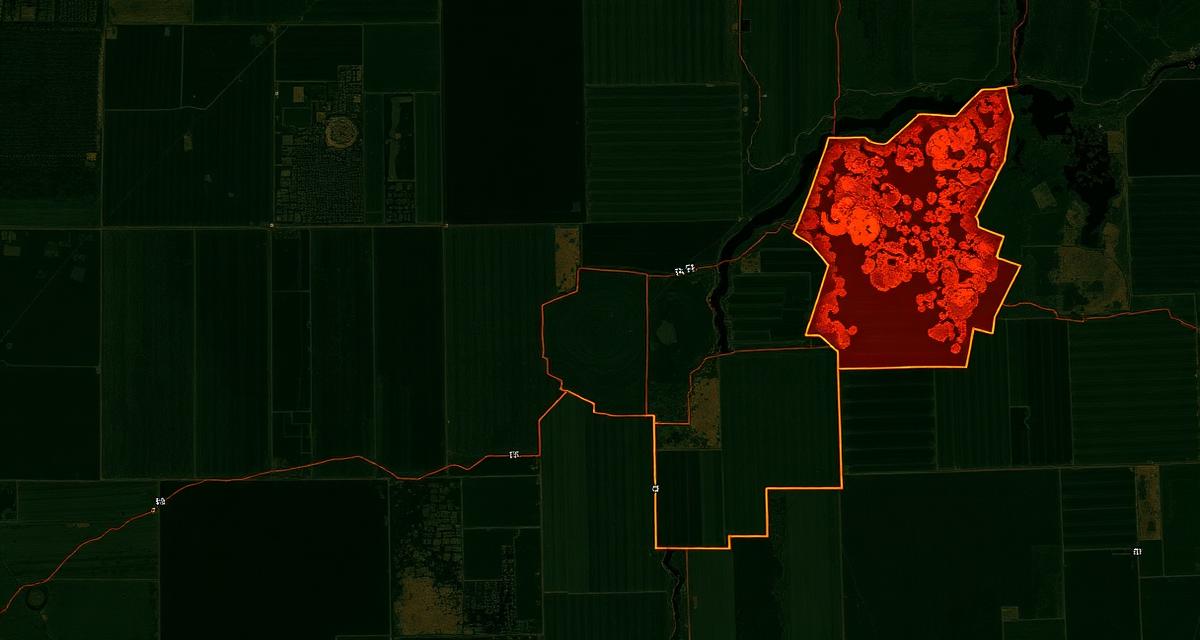
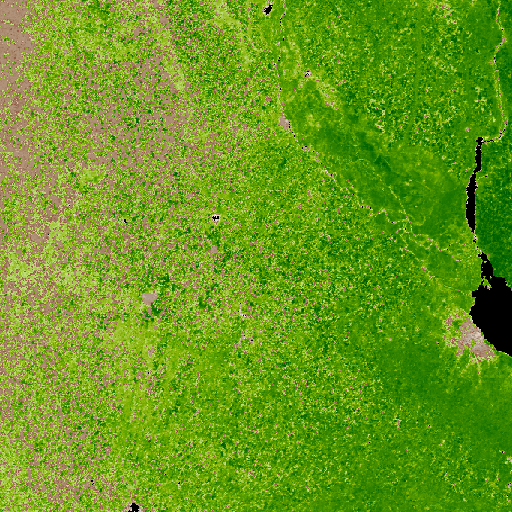
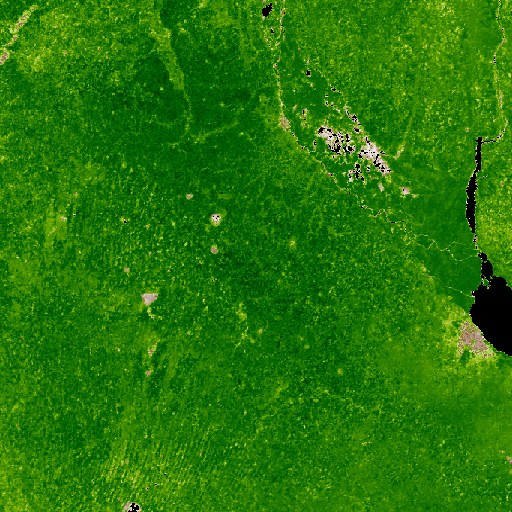
Real hail damage footprint, pre and post NDVIField map with the affected area and index analysis
Pre · Post · damage footprint
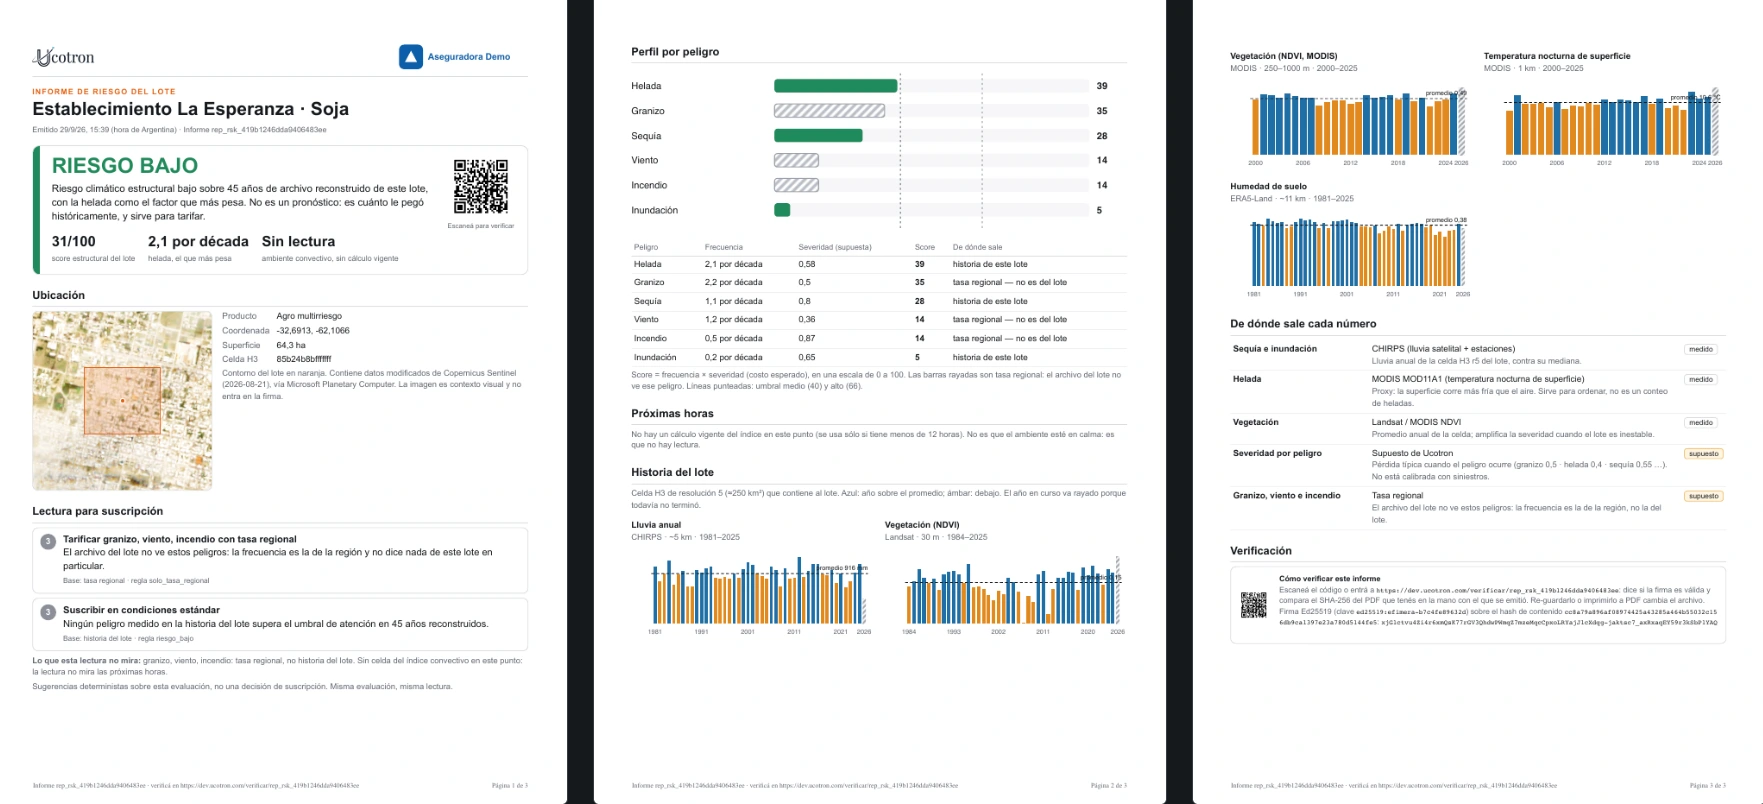
Underwriting

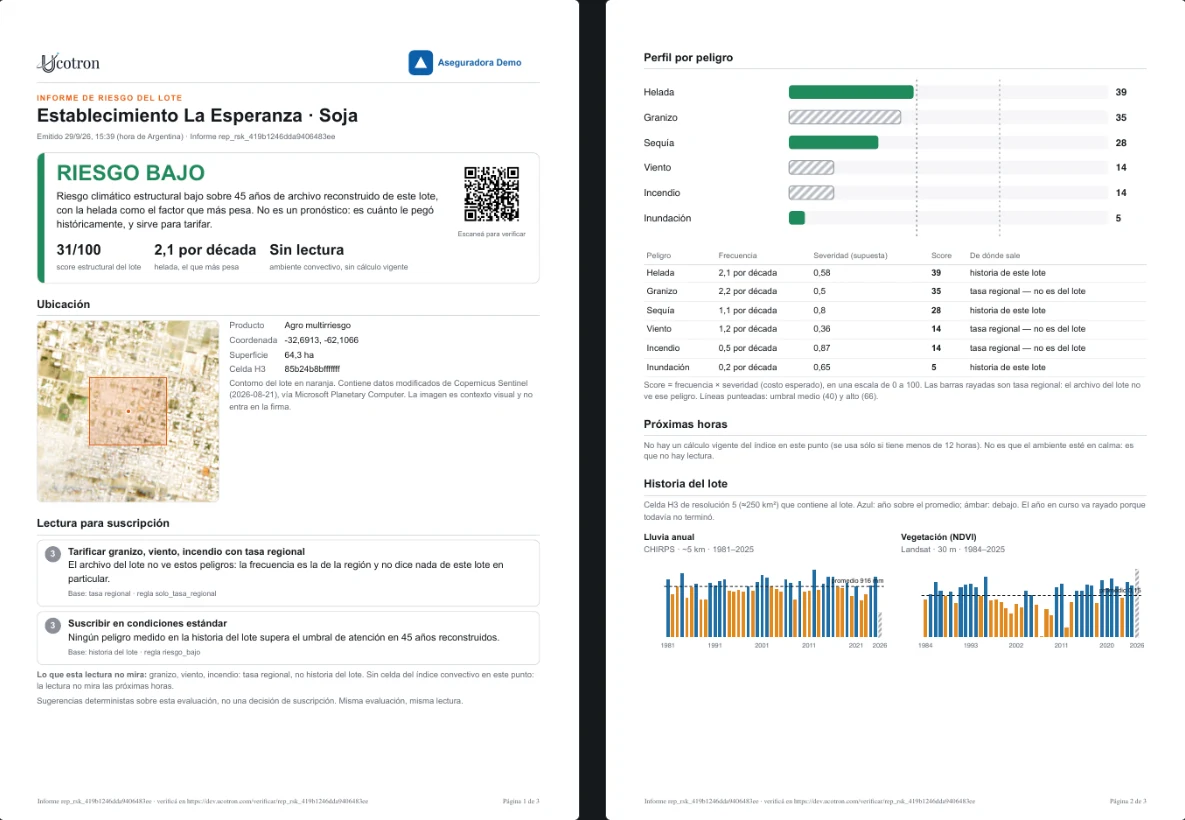
What is this location's real risk? Real history, not the zone average.

What you get

Location score built on forty years of satellite history: frequency, severity and return period for every climate event.

Used in: Underwriting, Renewal
Engine assessment with the field's own history
77SCORE
This location · not the zone average
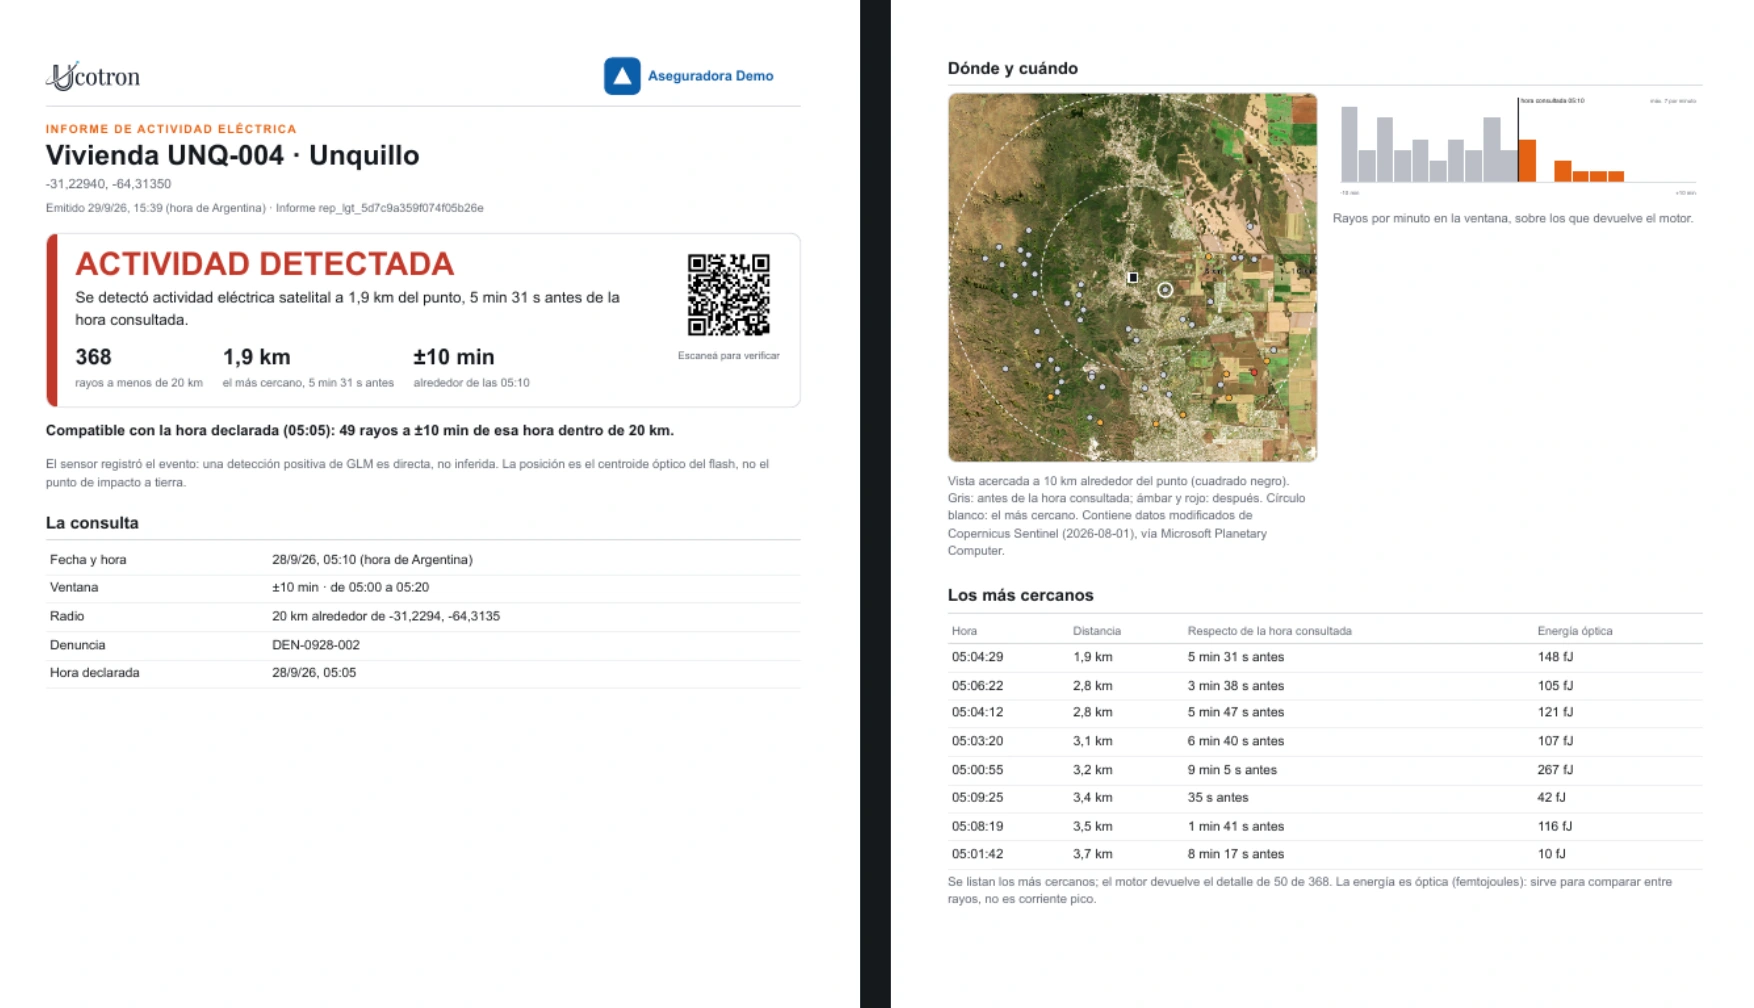
Lightning

Was there electrical activity consistent with that address and that date?

What you get

Auditable report of electrical activity detected by satellite near a date, a time and a coordinate.

Used in: Claims
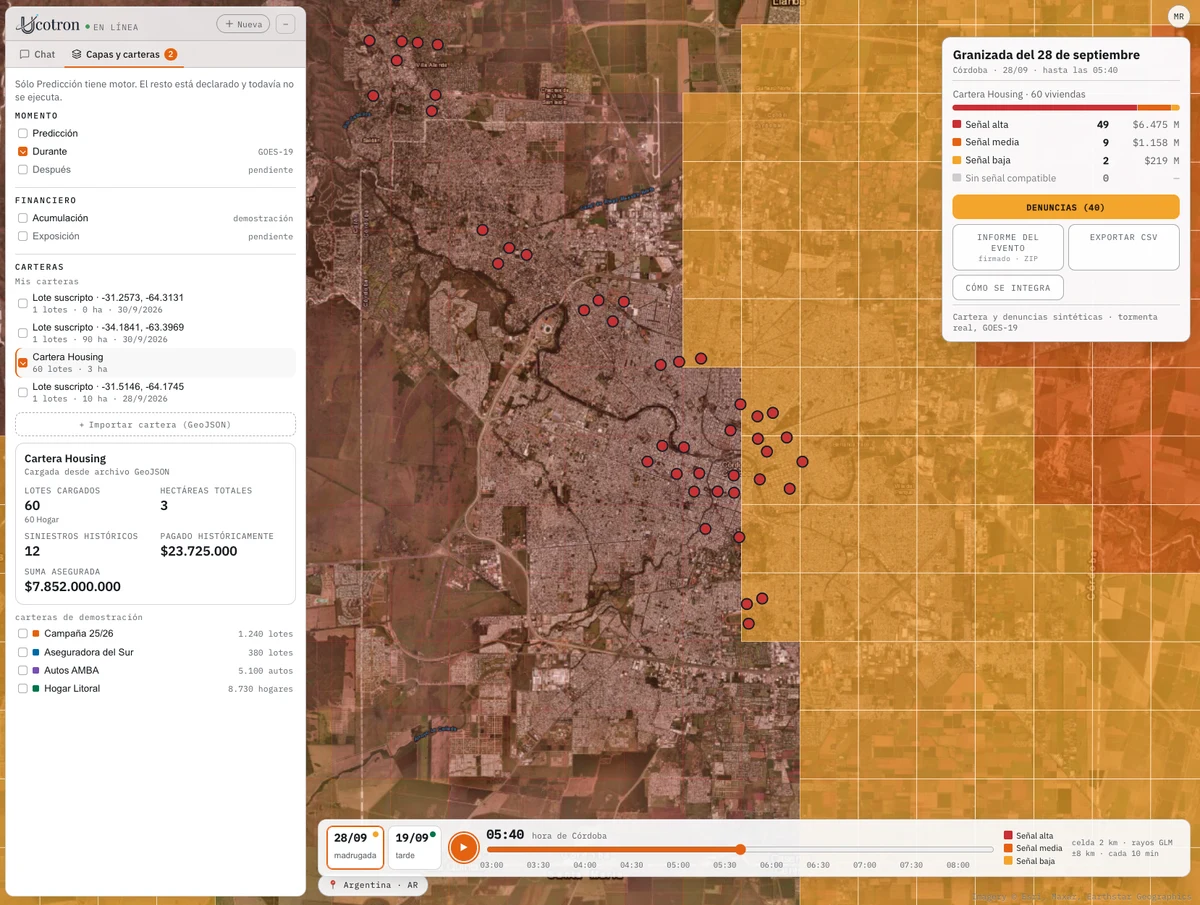
Map of flashes detected by GLM
Strike detected · radius and time
Housing

Is there a building at that location?

What you get

Verification that a building exists at that address, with the satellite image and the date backing it.

Used in: Underwriting, Claims
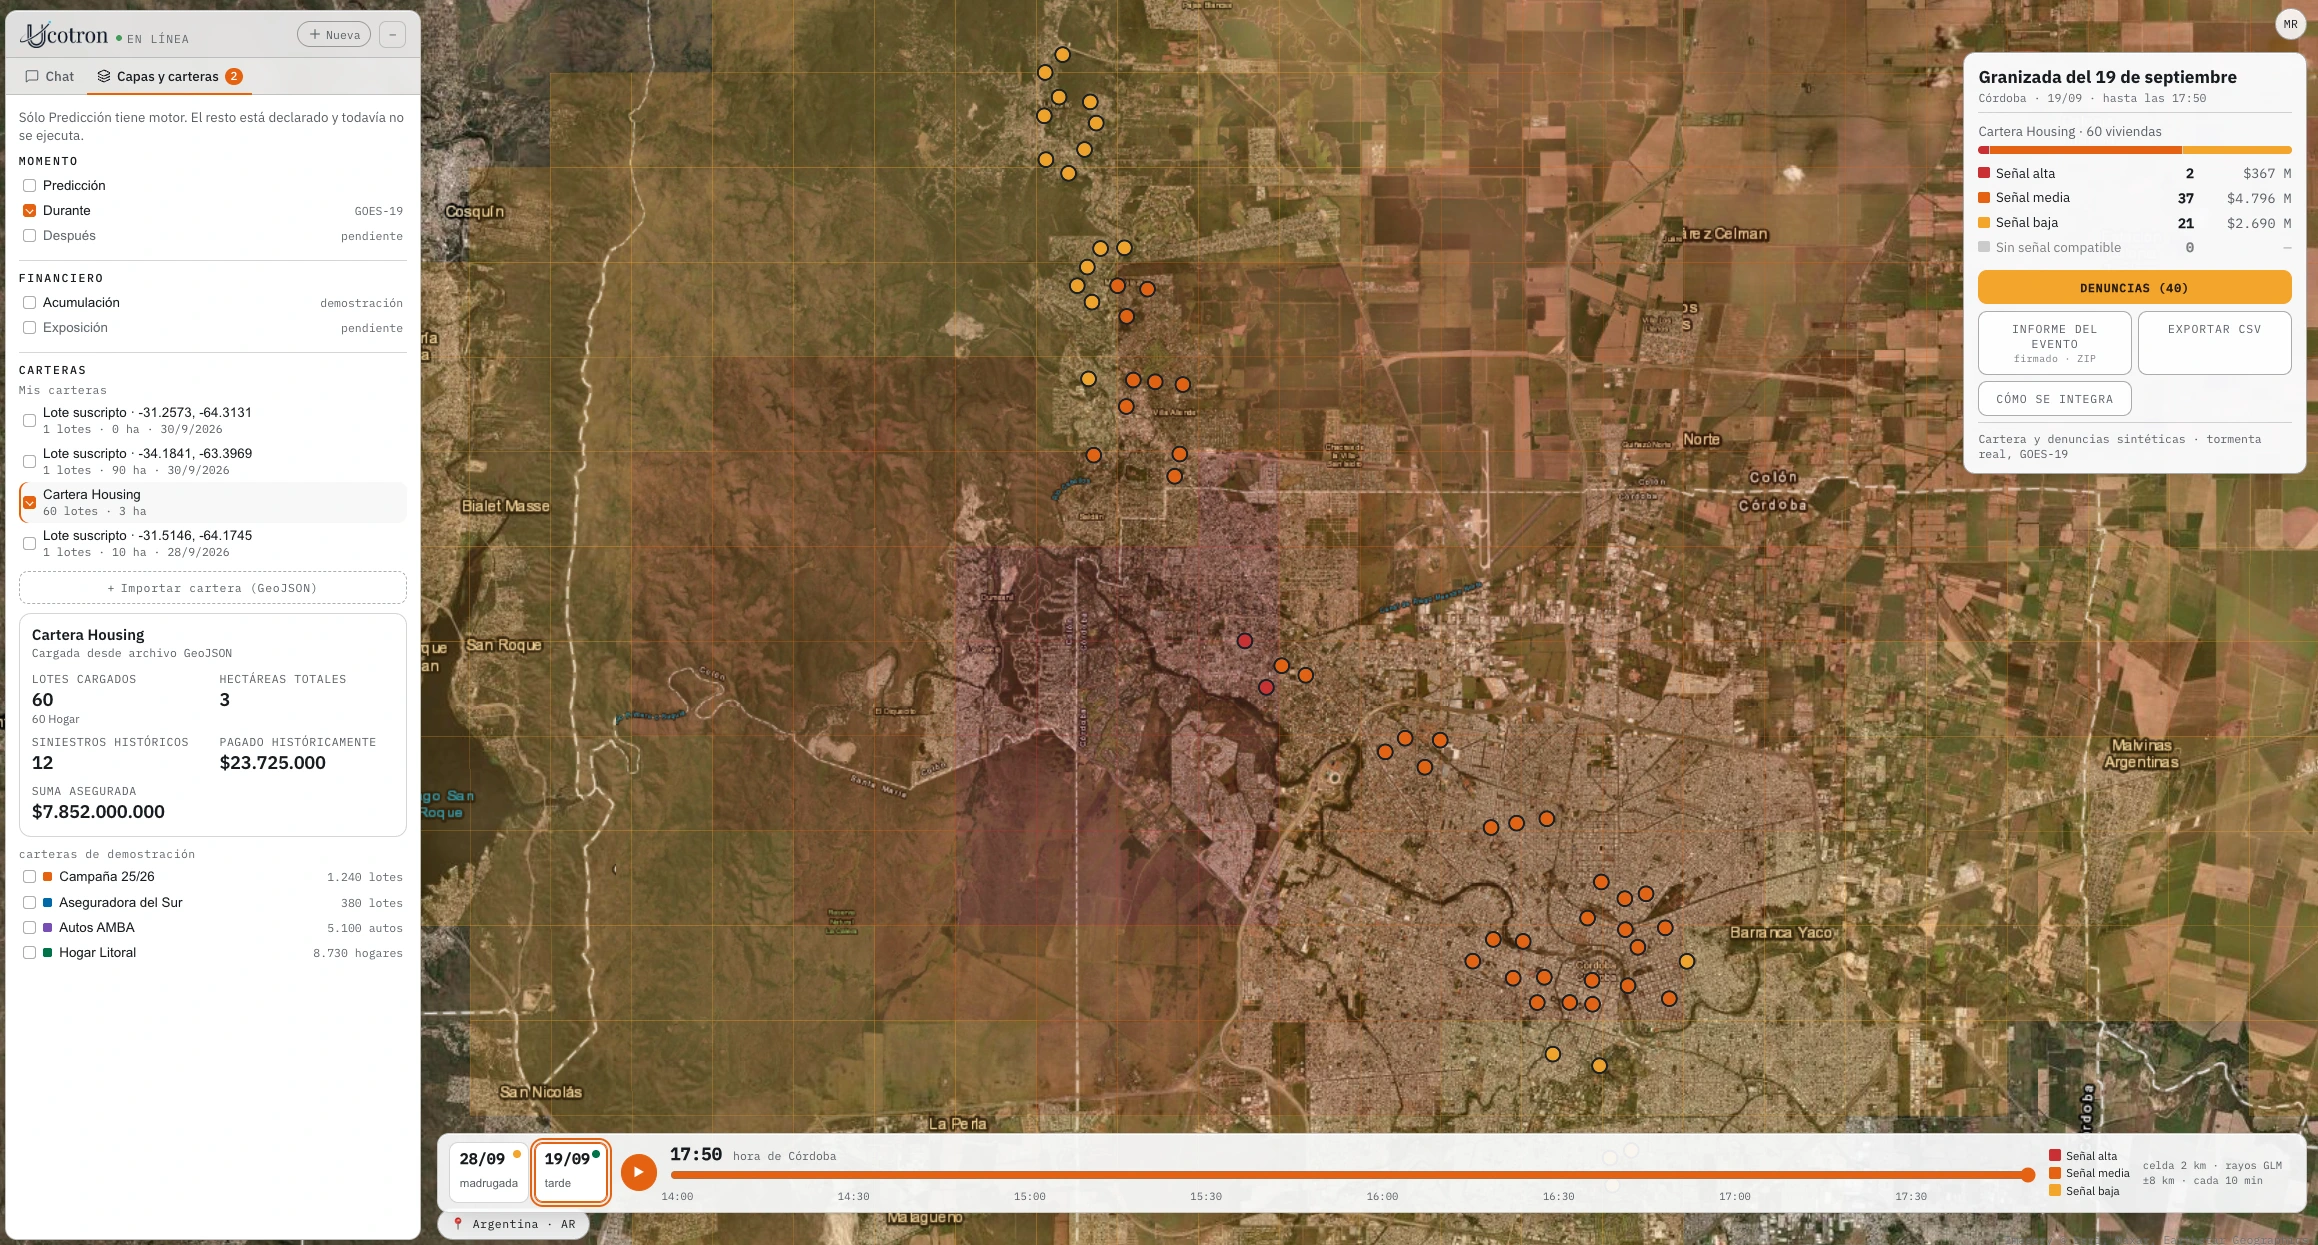
Buildings detected on the queried parcel
Hail swath · addresses hit
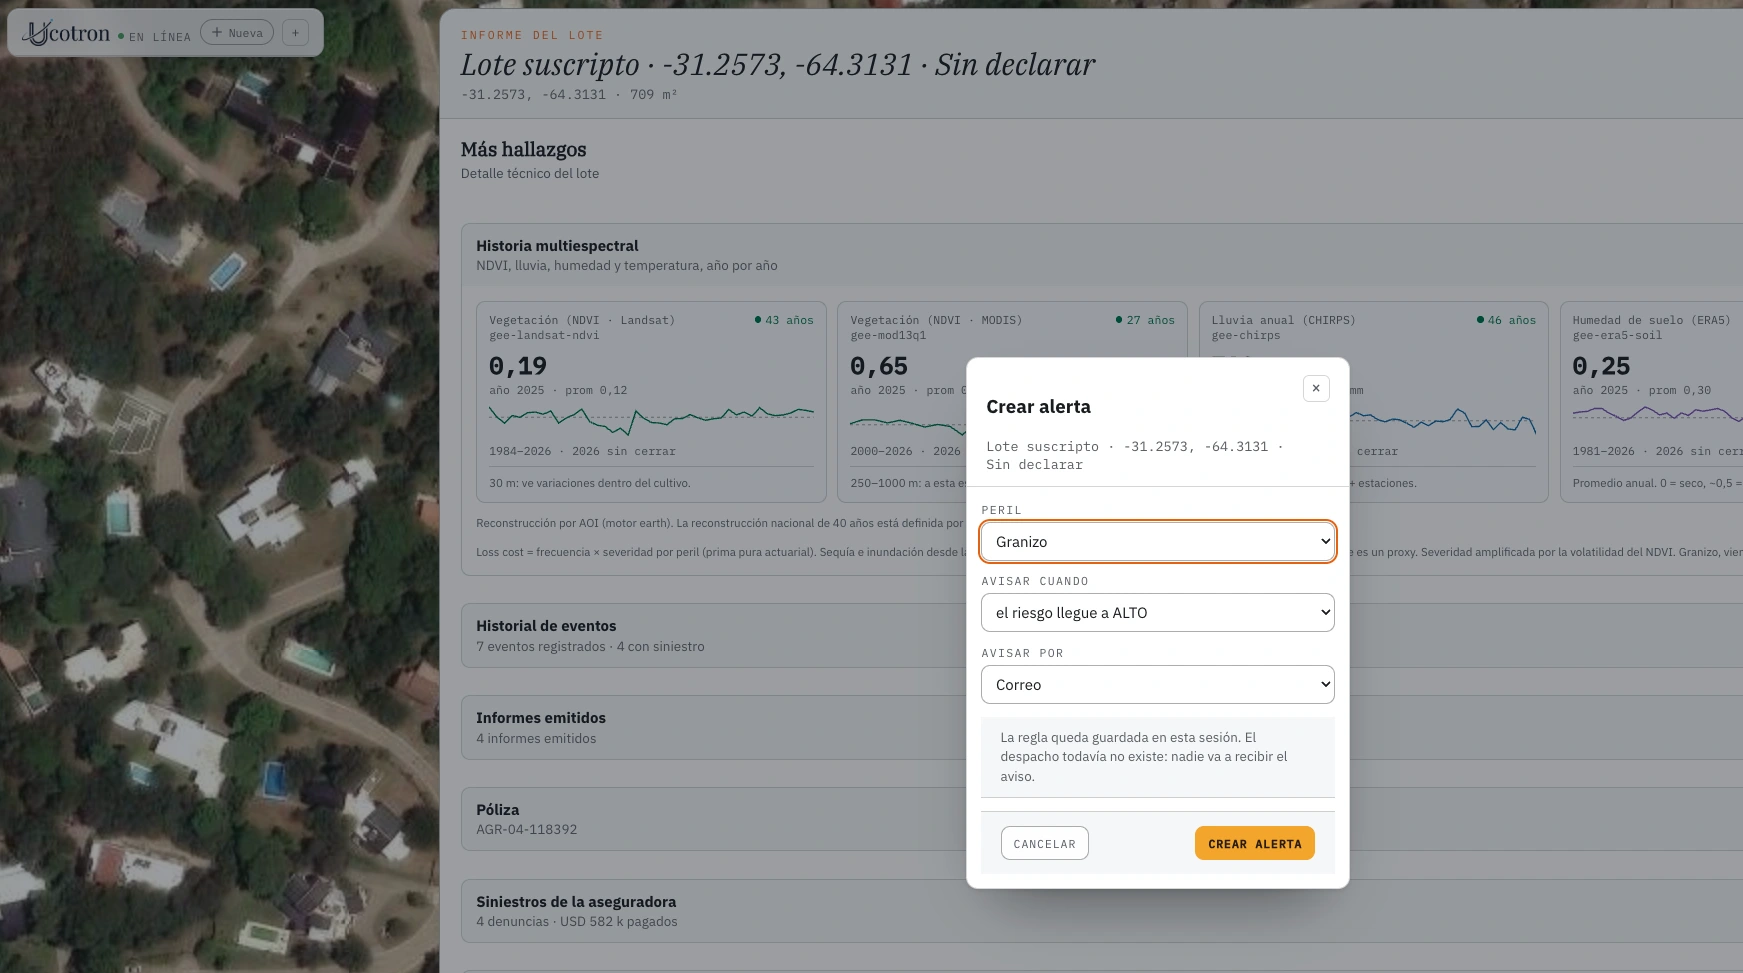
Weather alerts

We warn you before a weather event hits you — in time to act, not only to measure the damage afterwards.

E.g.: move the vehicle fleet under cover before a hailstorm.
What you get

A webhook or email alert when a cell with hail potential approaches the assets you loaded.

Used in: Monitoring, Claims
Cell with hail potentialAlert sent · 4 h ahead
Hours of advance warning
The engine

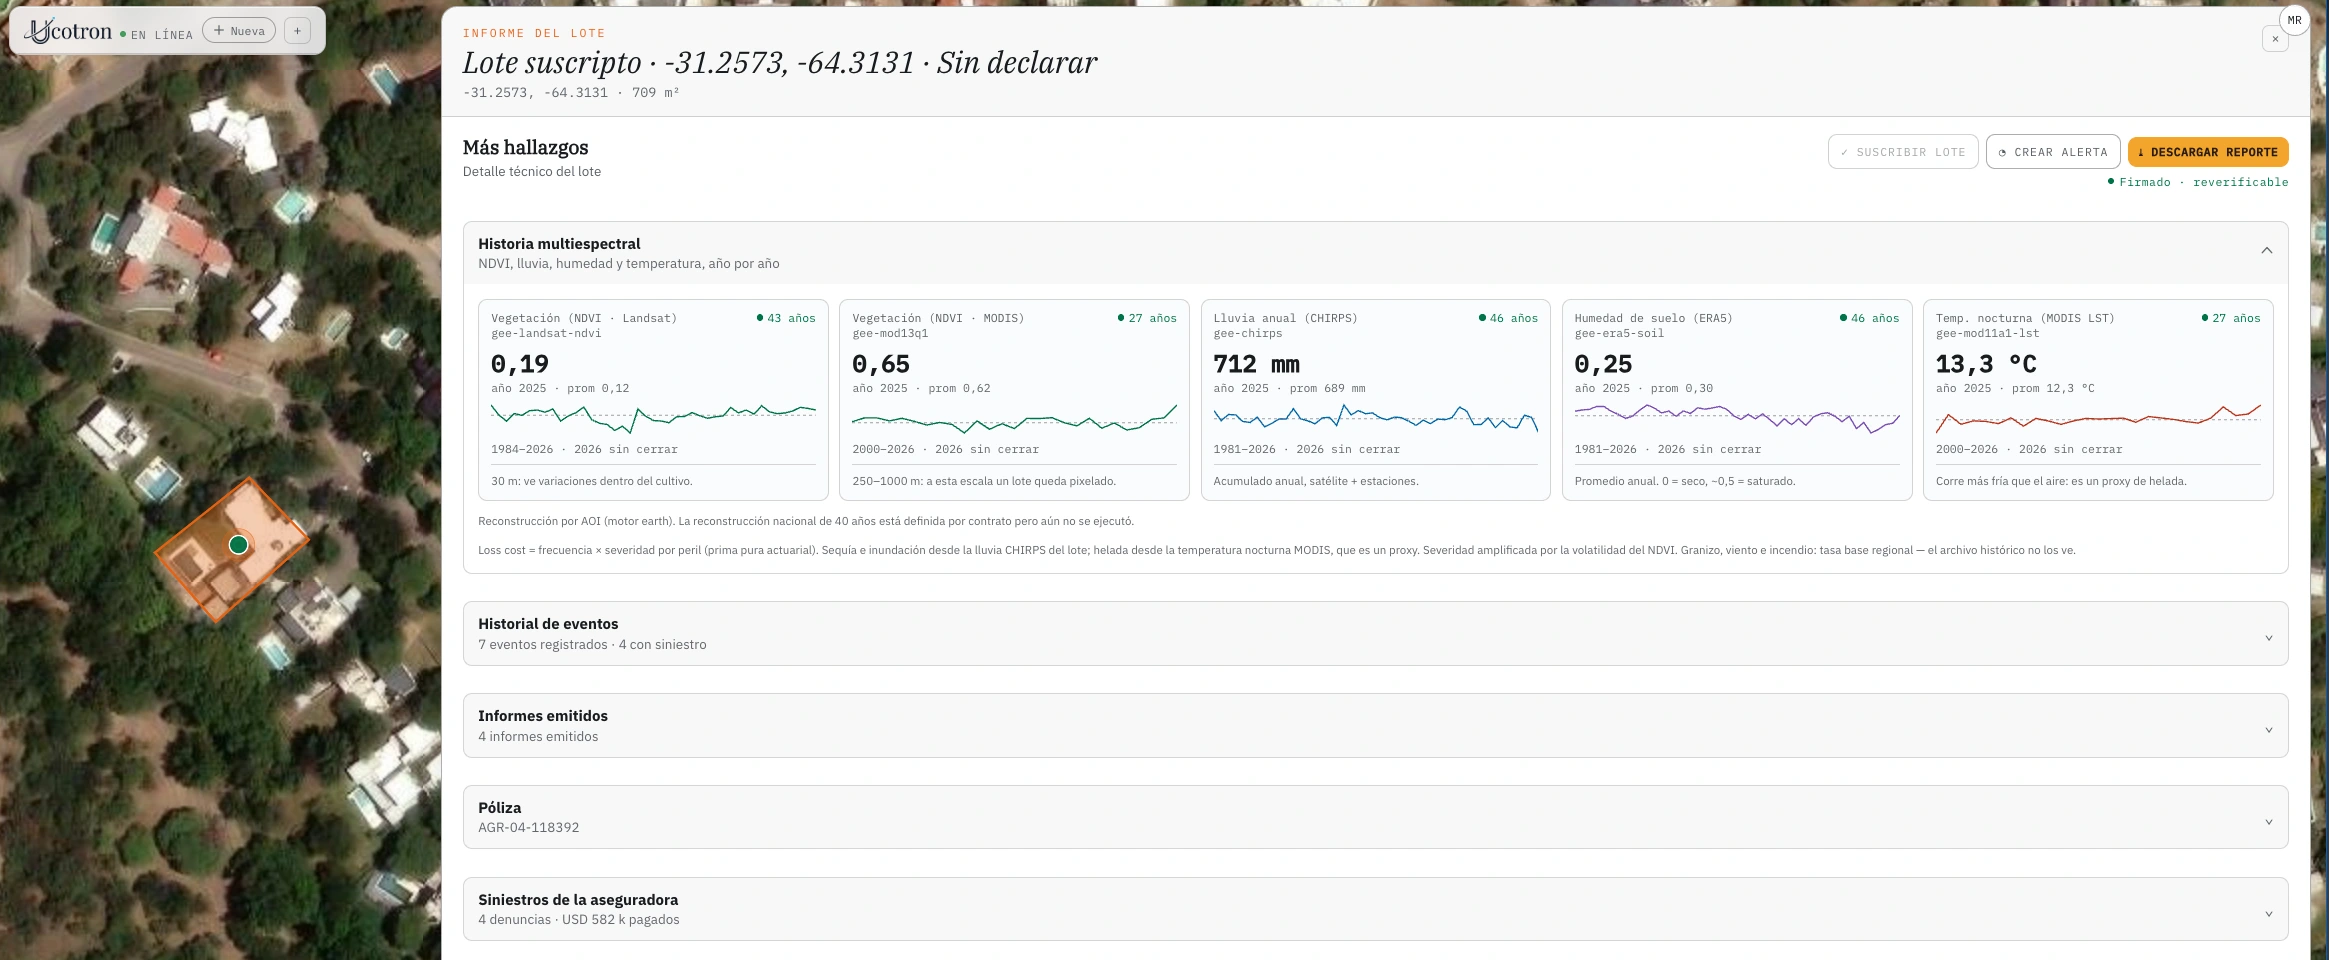
The ground remembers.

Forty years of imagery, weather, regulation and real claims stack up on the same grid, cell by cell. When you ask about a location, the engine doesn't start from scratch: it starts from that history. That's why the answer arrives with the source, the date and the signature behind it — and why it gets better with every claim that's confirmed.

Sources
Satellites
Years of imagery showing how every point on the ground changed.
Weather and soil
Rainfall, temperature and available water, cross-referenced by zone.
Official documents
Thousands of decrees, regulations and reports nobody finishes reading today.
Real claims
What actually happened, so the engine learns from reality.
UcotronENGINE
Signed reports
Product
Underwriting
Portfolio
Monitoring
Claims
Renewal
Sources Engine Signed reports
SatellitesYears of imagery showing how every point on the ground changed.
UcotronENGINE
Weather and soilRainfall, temperature and available water, cross-referenced by zone.
Official documentsThousands of decrees, regulations and reports nobody finishes reading today.
Real claimsWhat actually happened, so the engine learns from reality.
Product02
Underwriting03
Portfolio03
Monitoring02
Claims04
Renewal02

Four categories of sources go in, one engine processes them, six categories of signed reports come out.

The reports

More than 15 reports. A single engine.

Built with insurance experts, for every moment of the cycle. Here are some:

ProductRate zoningSignedPDF · 5p
ProductParametric trigger calibrationSignedPDF · 2p
UnderwritingRisk by fieldSignedPDF · 3p
UnderwritingRisk by addressSignedPDF · 5p
UnderwritingLightning exposureSignedPDF · 2p
PortfolioAccumulation by eventSignedPDF · 3p
PortfolioGeographic concentrationSignedPDF · 5p
PortfolioReinsurance dossierSignedPDF · 2p
MonitoringImminent event alertSignedPDF · 3p
MonitoringPolicyholder noticeSignedPDF · 5p
ClaimsDamage assessment with footprintSignedPDF · 2p
ClaimsOccurrence verificationSignedPDF · 3p
ClaimsLightning verificationSignedPDF · 5p
ClaimsPre and post event comparisonSignedPDF · 2p
RenewalWhat to re-rateSignedPDF · 3p
RenewalWhat not to renewSignedPDF · 5p
ProductRate zoningSignedPDF · 2p
ProductParametric trigger calibrationSignedPDF · 3p
UnderwritingRisk by fieldSignedPDF · 5p
UnderwritingRisk by addressSignedPDF · 2p
UnderwritingLightning exposureSignedPDF · 3p
PortfolioAccumulation by eventSignedPDF · 5p
PortfolioGeographic concentrationSignedPDF · 2p
PortfolioReinsurance dossierSignedPDF · 3p
MonitoringImminent event alertSignedPDF · 5p
MonitoringPolicyholder noticeSignedPDF · 2p
ClaimsDamage assessment with footprintSignedPDF · 3p
ClaimsOccurrence verificationSignedPDF · 5p
ClaimsLightning verificationSignedPDF · 2p
ClaimsPre and post event comparisonSignedPDF · 3p
RenewalWhat to re-rateSignedPDF · 5p
RenewalWhat not to renewSignedPDF · 2p

Every report comes signed, and is generated via API, PDF or whatever format your system needs.

Need a report that isn't here? The engine is the same. Tell us what decision you have to make.

It's already built

Reach the engine where you already work. Or make it part of your own.

Three ways to use the same engine: where your team already talks, in your technical stack, or embedded inside your own product.

Via API
Via MCP
Embedded
# agro-risk
Underwriting
How much damage did field 27 take from the hail on Feb 16?
U
UcotronAPP
71.6% damage over 84 ha. Footprint confirmed with pre/post NDVI.
claim-field-27.pdf
Message #agro-risk
Agro risk · Chat
How much damage did field 27 take from the hail on Feb 16?
U
71.6% damage over 84 ha. Footprint confirmed with pre/post NDVI.
claim-field-27.pdf
Type a message
U
Ucotron
online
How much damage did field 27 take from the hail on Feb 16?
71.6% damage over 84 ha. Footprint confirmed with pre/post NDVI.
claim-field-27.pdf
Type a message
ClaudeMCP · UCOTRON
How much damage did field 27 take from the hail on Feb 16?
ucotron · field_claim1,4 s
field: 27 · event: 2026-02-16
net_damage: 71.6% · area: 84 ha
71.6% damage over 84 ha. Footprint confirmed with pre/post NDVI.
claim-field-27.pdf
Ask Claude something
ChatGPTUCOTRON
How much damage did field 27 take from the hail on Feb 16?
U
71.6% damage over 84 ha. Footprint confirmed with pre/post NDVI.
· Affected area: 84 ha
· Source: pre/post Sentinel-2 NDVI
claim-field-27.pdf
Ask anything
Your system · Claim #4821
UUcotronSDK
How much damage did field 27 take from the hail on Feb 16?
71.6% damage over 84 ha. Footprint confirmed with pre/post NDVI.
claim-field-27.pdf
Query the engine
UcotronENGINE
Would you rather see what it would have saved you first?

Ten years of weather in your portfolio. We show you what would have happened.

Send us your policy and climate claims history from the last decade. With your own data, we show you which claims would have been anticipated and which risks were mispriced — under NDA, no strings attached.

Retrospective · Demo portfolio · 2017–2026 Live
With Ucotron underneath, this portfolio would have avoidedUSD 41MOver ten years. Illustrative figure on a synthetic portfolio — yours comes from crossing your own data.
What you would have avoided, year by year USD millions
1,5
'17
2,1
'18
1,9
'19
3,0
'20
3,3
'21
4,3
'22
4,9
'23
5,8
'24
6,7
'25
7,5
'26
Claims anticipated312of 1,480 events
Mispriced premium18,4%of the demo portfolio
Avoidable assessments1.106of 1,480 field visits
Synthetic data · Example view
They trust us

Part of the region's insurtech ecosystem.

Cámara Insurtech ArgentinaAsociación Insurtech Panamericana

Stop insuring blind.