01Claims

Verify a hail claimagainst the event footprint.

  • Claims
  • Adjusters
  • Loss adjusters

The pain

Satellite imagery is used case by case and by hand, and no one separates event damage from what the field normally does.

Many insurers already compare Sentinel-2 before and after, but case by case and by hand, with little automation.
Hail loss adjustment · Sentinel-2
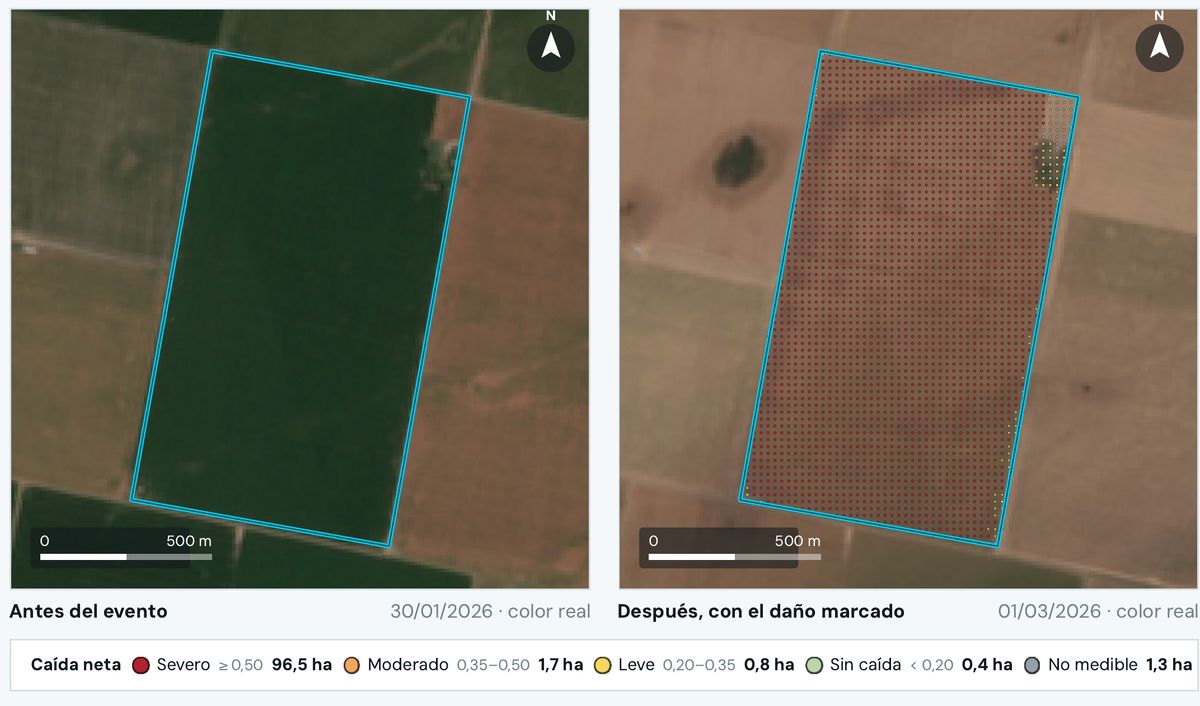
The field in true color: green on Jan 30, 2026 and straw-colored on Mar 1, 2026, with the greenness-drop grid
1Jan 30 · full green2Mar 1 · each red dot is a severe drop396.5 ha with severe drop41.3 ha not measurable: reported separately
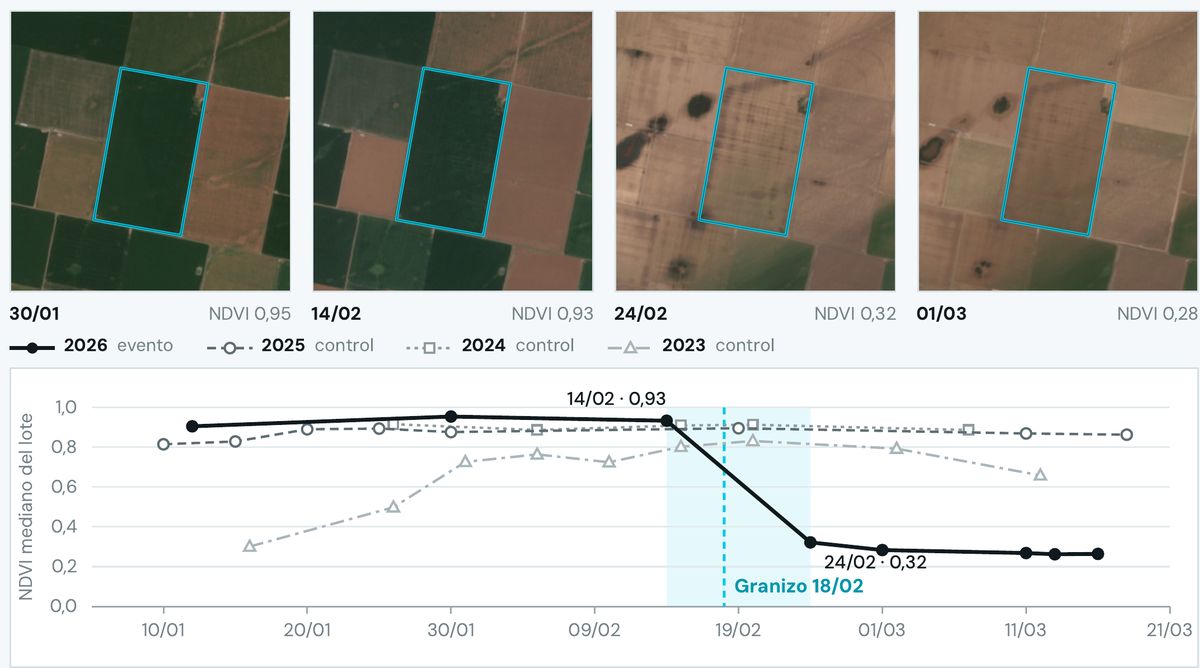
Four crops of the field and the 2026 NDVI curve dropping after Feb 18, against the flat controls
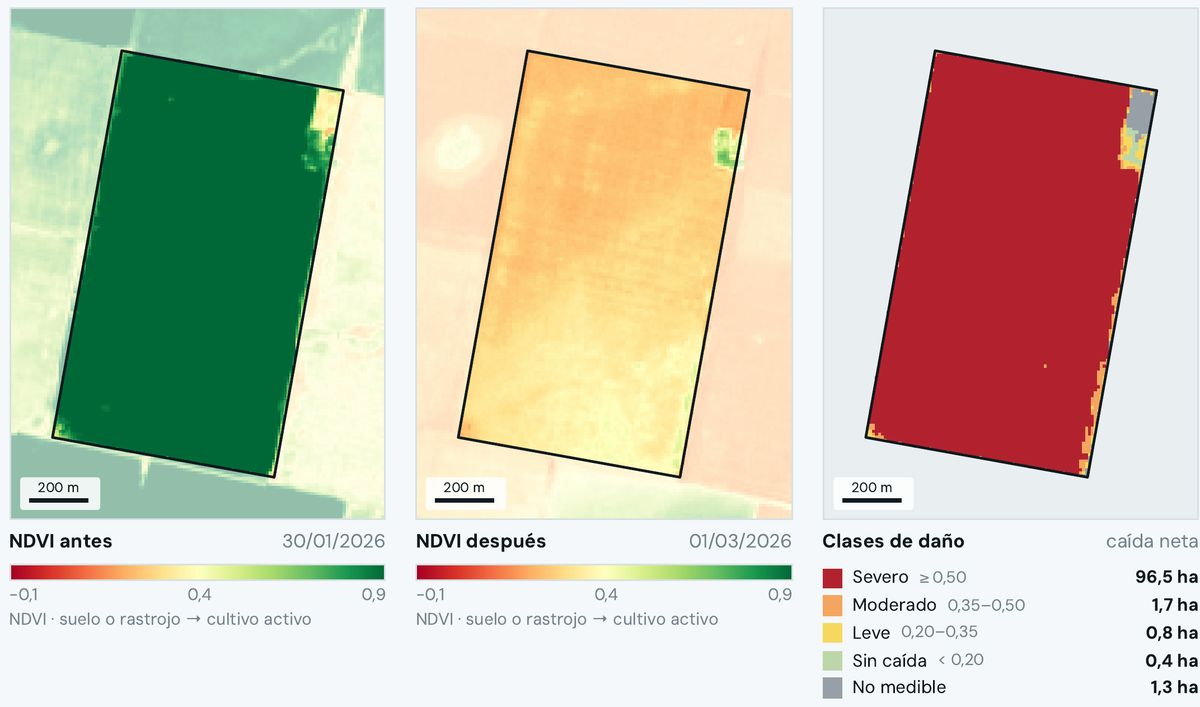
Three maps of the field: NDVI before, NDVI after and drop classes
A 100.8 ha field in Armstrong: green on Jan 30 and straw-colored on Mar 1, with the net drop marked point by point.The 2026 NDVI curve drops after Feb 18; the 2023 to 2025 curves, on the same dates, stay flat.NDVI before, NDVI after and drop classes for the field, with what's not measurable in gray.
  1. Jan 30 · full green
  2. Mar 1 · each red dot is a severe drop
  3. 96.5 ha with severe drop
  4. 1.3 ha not measurable: reported separately

What Ucotron does

  1. 1
    Reconstructs the swathUsing GOES-19 lightning and Sentinel-2 imagery, it draws where the storm passed.
  2. 2
    Compares the field against itselfNDVI before and after, pixel by pixel at 10 m, minus the control from its three previous seasons.
  3. 3
    Signs the assessmentConsistent, not consistent or not measurable, verifiable by QR. The damage percentage is set by the loss adjuster.

Real engine example · Armstrong, Feb 18, 2026 hailstorm

0,95 → 0,28Field NDVI before and after
99.1 hawith net drop: 98.3% of a 100.8 ha field
+0,001how much the 2023–2025 control moved

A pilot measures one thing: the days between the claim and the first evidence.
02Claims

Sort the claimsthe day after the storm.

  • Claims management
  • Loss adjusters

The pain

Hundreds of claims arrive at once, all seem urgent, and the loss adjuster goes out to search instead of validate.

Today the loss adjuster goes out to look for the damage, when they should go to the field to validate it.

Event report · GOES-19 GLM
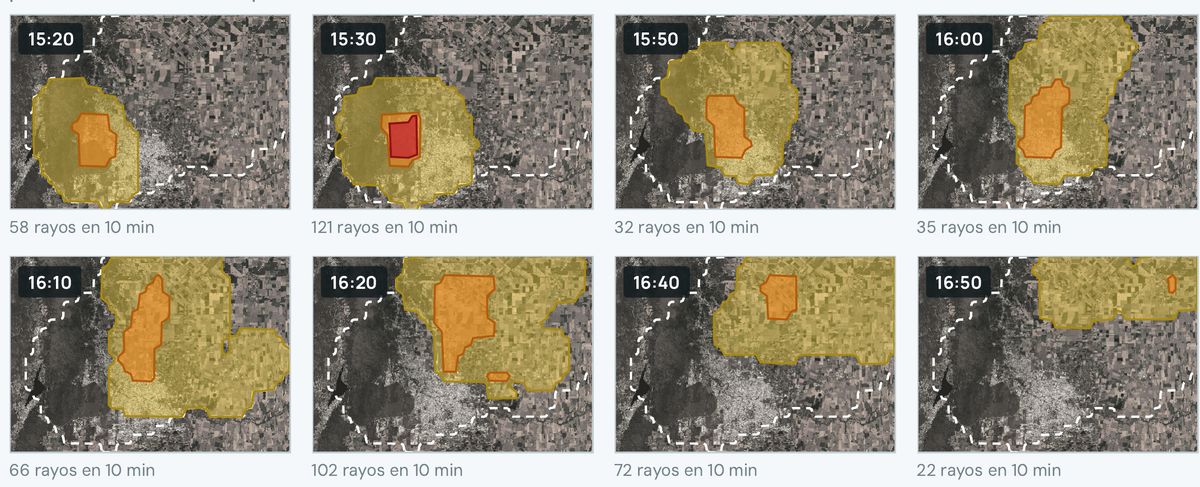
Eight 10-minute frames showing the storm footprint moving and the lightning in each frame
115:30 · peak of 121 flashes216:10 · the core keeps moving northeast316:50 · the signal fades
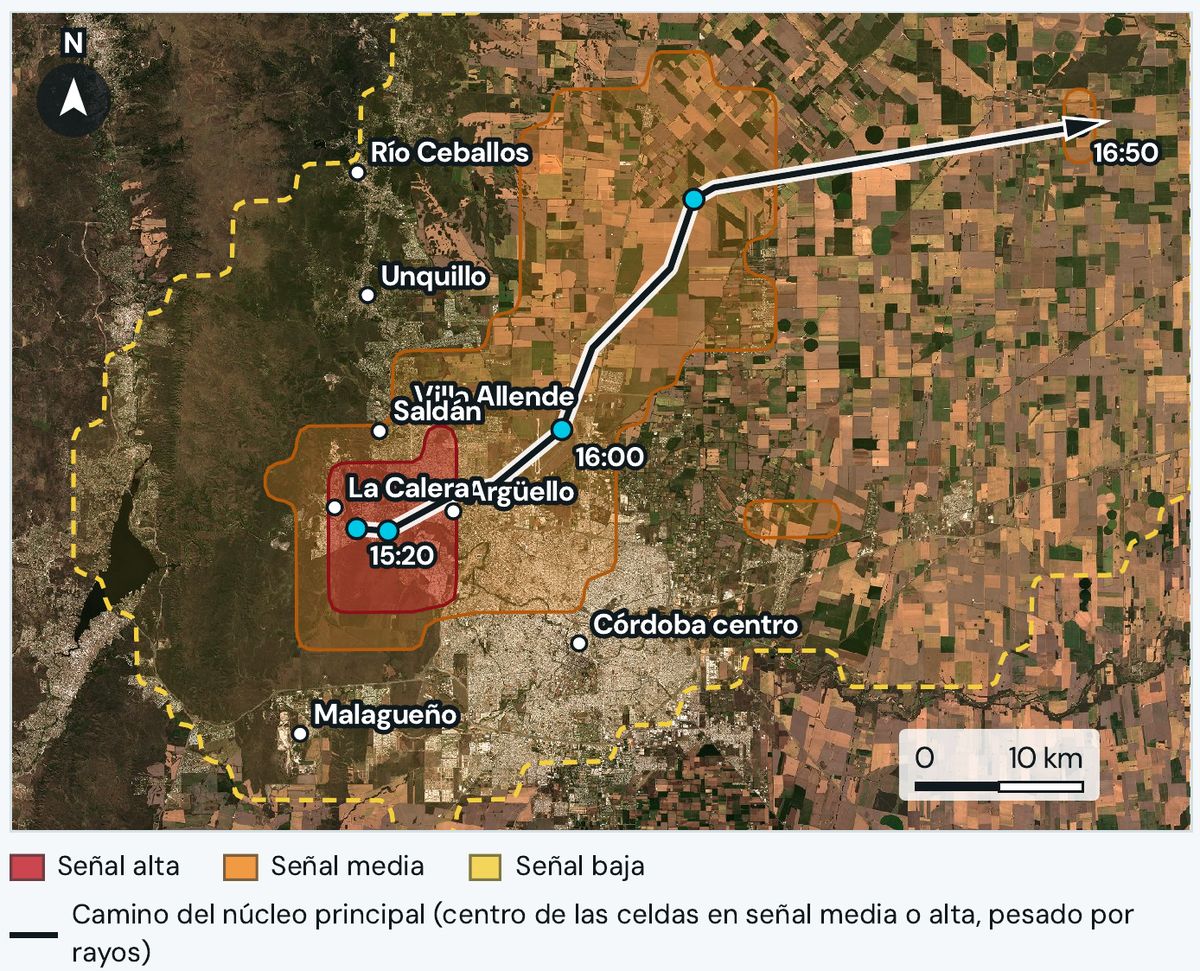
Storm footprint in high, medium and low bands over Sierras Chicas and Córdoba
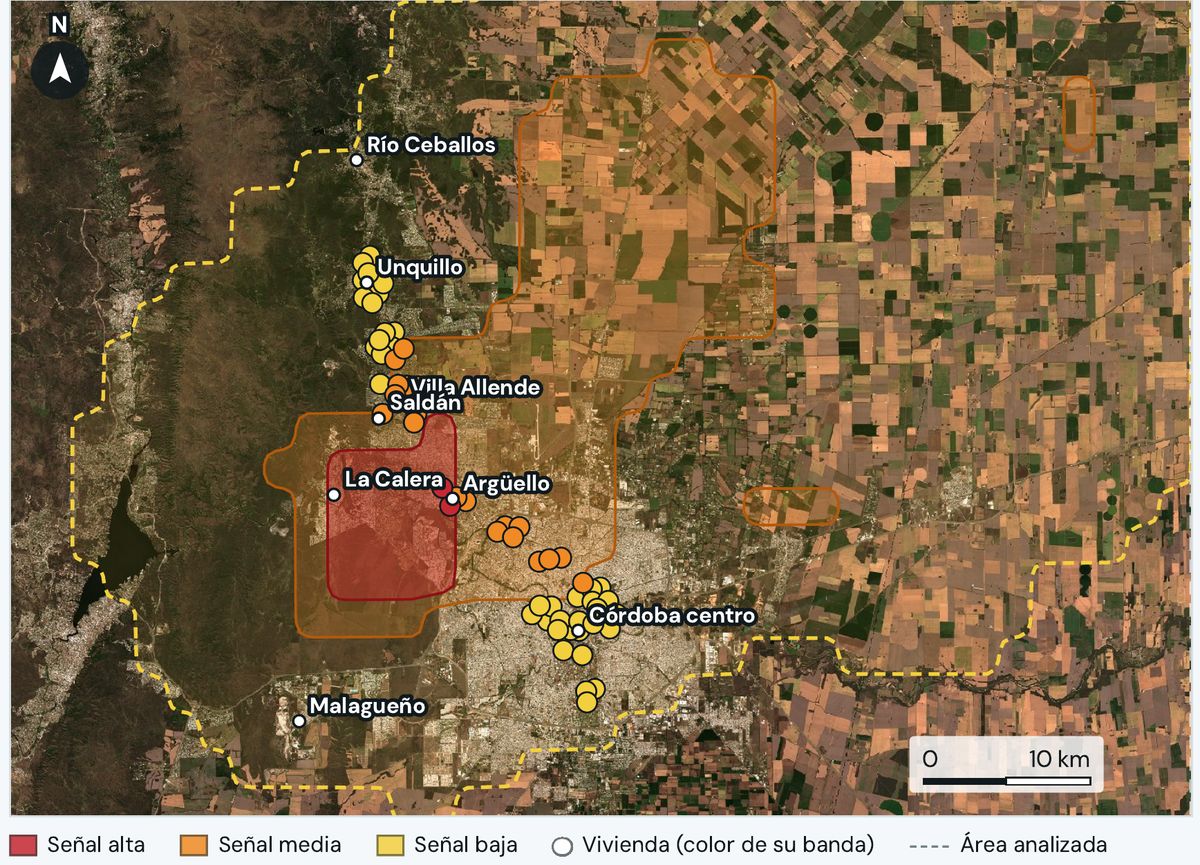
The storm footprint with homes colored by band, from a demo portfolio
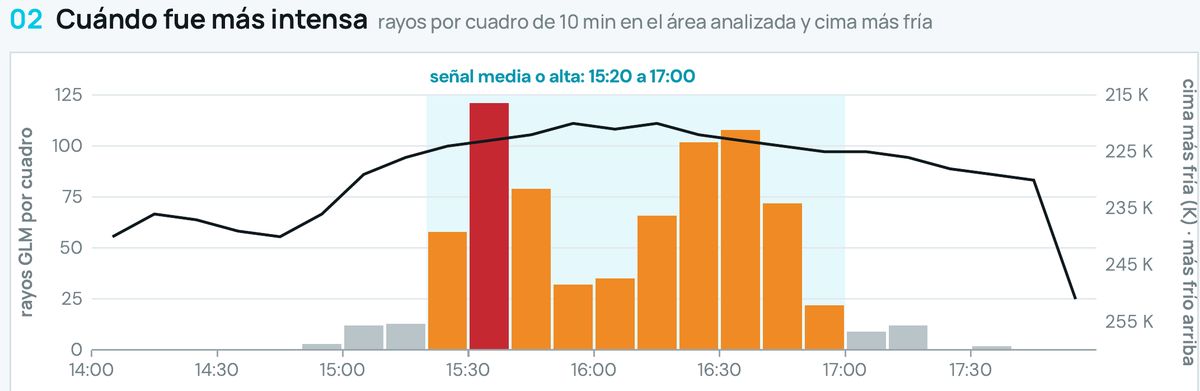
The Sep 19 storm in eight 10-minute frames, from 15:20 to 16:50, with the lightning in each.The Sep 19 footprint in high, medium and low bands, with the core's path from 15:20 to 16:50.The same footprint over homes, each with its band. Demo portfolio.
  1. 15:30 · peak of 121 flashes
  2. 16:10 · the core keeps moving northeast
  3. 16:50 · the signal fades

What Ucotron does

  1. 1
    Measures the footprint every 10 minutesGLM lightning and cloud-top temperature, in high, medium and low signal bands.
  2. 2
    Matches it against each claimEach field or home, against the band it fell in and the time.
  3. 3
    Builds three queuesConsistent, inconclusive and no consistent activity, each with its reason. None is rejected automatically: a person decides.

Real engine example · Córdoba, Sep 19, 2026 · demo portfolio

557 km²with medium or high signal
121lightning flashes in 10 minutes, at the 15:30 peak
60demo homes matched against the footprint

2in high signal

19in medium signal

39in low or no signal

03Reinsurance

The day after, for reinsurance:a number that doesn't need correcting.

  • Reinsurance
  • Actuarial
  • Technical management

The pain

The exposed hectares reported to the reinsurer grow as claims come in, and what was already reported has to be corrected.

It's common for the reported hectares to grow from one week to the next: the swath is drawn by hand and everyone waits for the claims.

Accumulation report · GOES GLMDemo portfolio
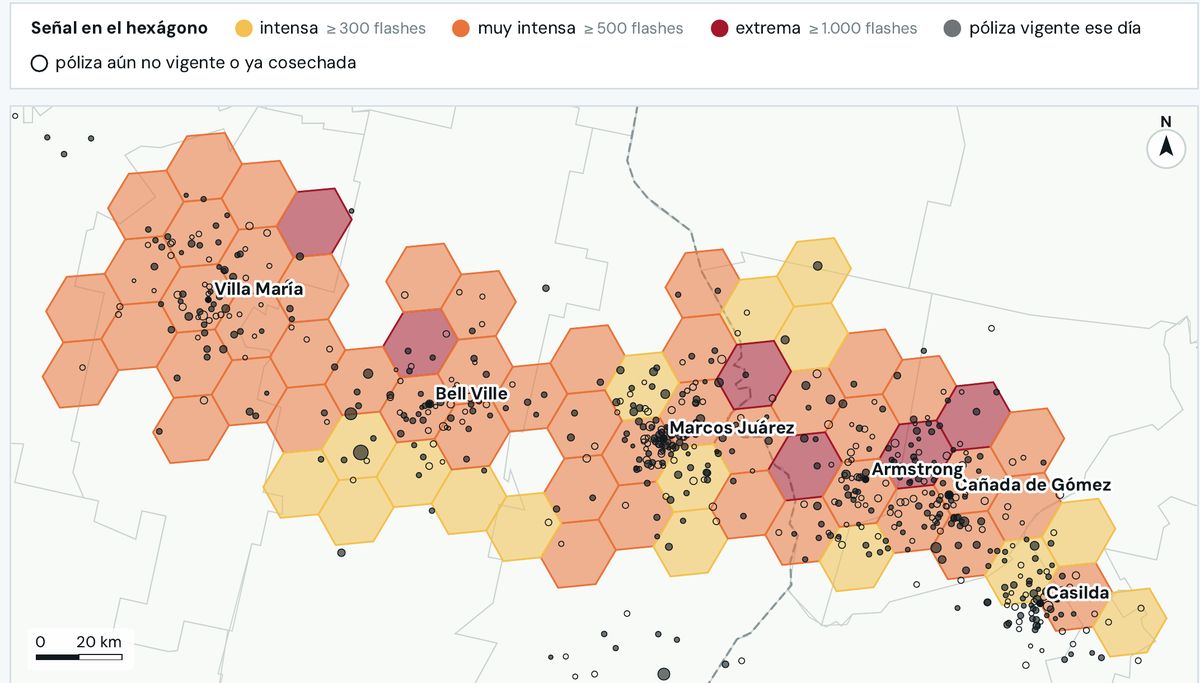
Hail signal hexagons from the Nov 11, 2018 storm between Villa María and Casilda, with demo policies as points
1Each hexagon, with its signal intensity2Extreme: 1,000 flashes or more3Each dot, a demo policy
Sentinel-2 view of 50 by 27 km with the straw-colored hail swath crossing diagonally
Lightning bars per 10-minute frame with cloud-top temperature
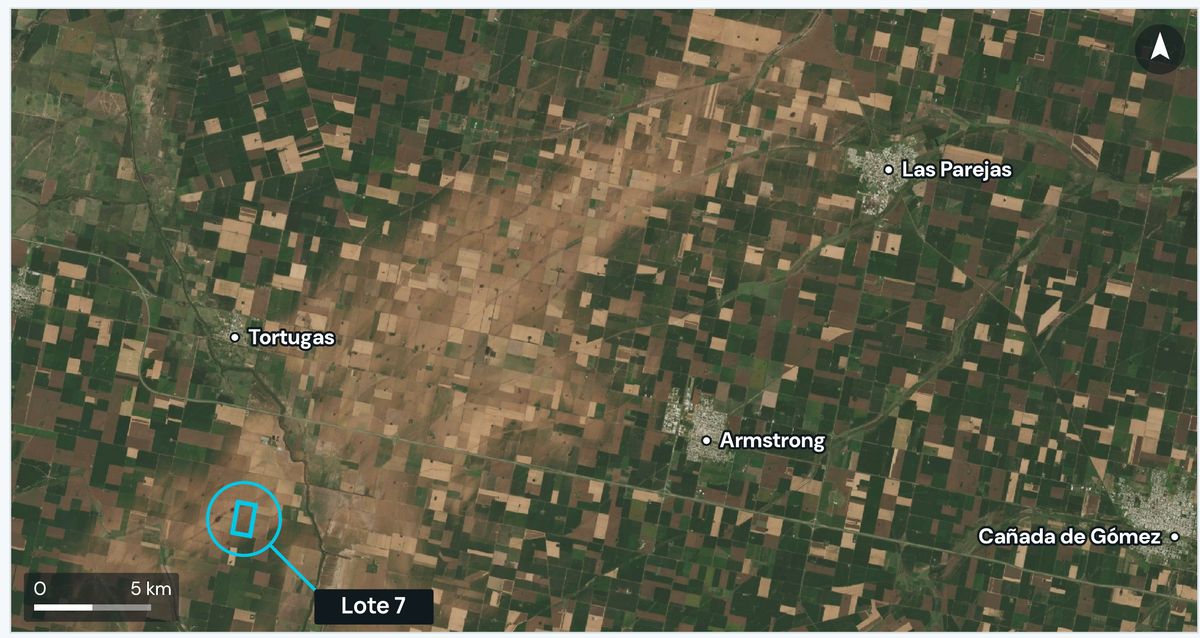
The Nov 11, 2018 storm between Villa María and Casilda, transposed onto a demo portfolio.The Feb 18, 2026 swath in Sentinel-2: 50 × 27 km between Tortugas, Armstrong, Las Parejas and Cañada de Gómez.GLM lightning per 10-minute frame and cloud-top temperature, Córdoba, Sep 19, 2026.
  1. Each hexagon, with its signal intensity
  2. Extreme: 1,000 flashes or more
  3. Each dot, a demo policy

What Ucotron does

  1. 1
    Measures the swath as soon as it endsThe event footprint in bands, without waiting for claims to arrive.
  2. 2
    Calculates exposureHectares and exposed sum insured per band over your portfolio, or the swath as a layer to cross-reference in your GIS without sharing the portfolio.
  3. 3
    Versions the figureIf the number changes, a revision goes out with its reason. Before renewal, the concentration by zone and the worst storms of recent years over today's portfolio.

The metric measured in a pilot

v1the day-one number, with its date and version
12,000 → 20,000 hawhat gets corrected today as claims come in
  • Today: the number grows with every claim
  • With the swath measured on day one: version 1, and revisions only with a reason

The metric is the difference between the first reported number and the final one. We haven't measured it with a client yet.

04Underwriting

Underwrite field by field,with the place's history and no adverse selection.

  • Underwriting
  • Brokers who quote

The pain

Quotes use the zone's rate and what the policyholder declares, and a field that has already been hit by hail can be insured after the event.

If no one checks the area while the application is drawn, a field that was already hit by hail gets insured anyway and shows up ten days later as a claim.

Field risk · Landsat and Sentinel-2
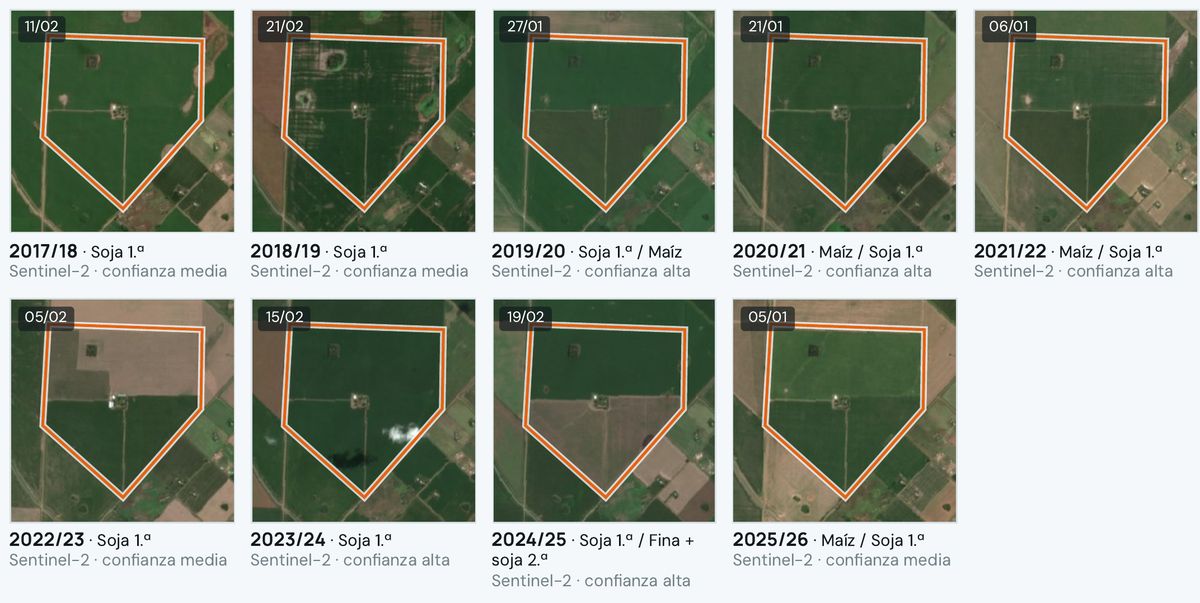
Nine Sentinel-2 crops of the same field, from 2017/18 to 2025/26, with the likely crop of each season
12017/18 · first-crop soybean, medium confidence22024/25 · wheat plus second-crop soybean3Each season, with its confidence
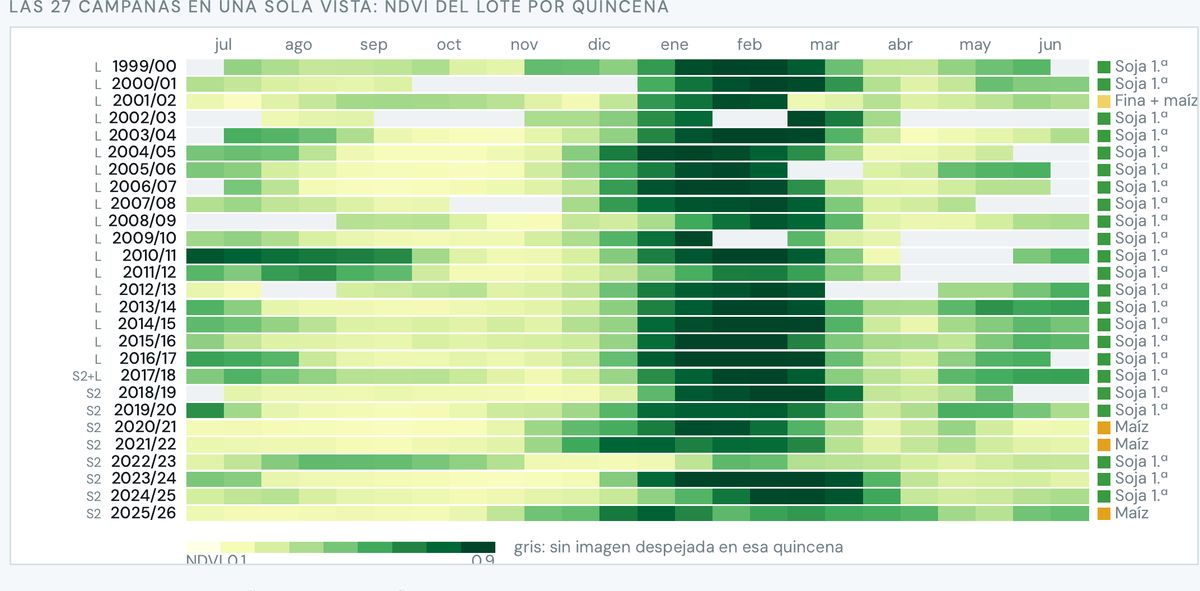
NDVI heat map of the field by fortnight over 27 seasons
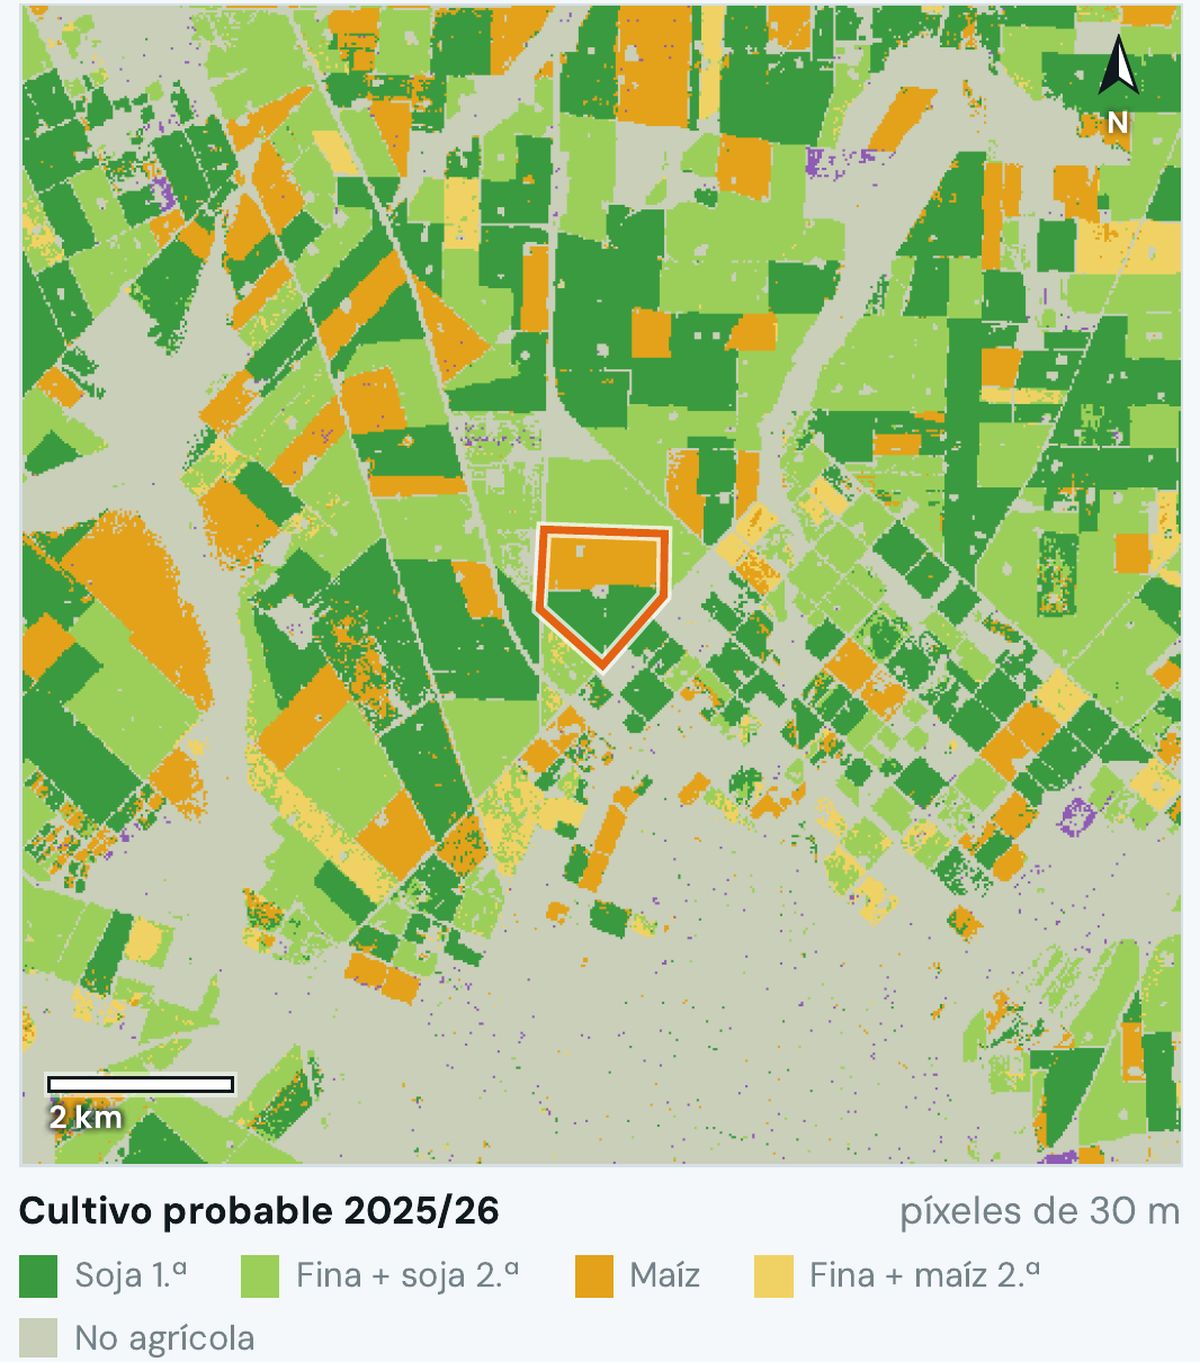
Likely crop map 2025/26 in 30 m pixels around the field
The same field over nine seasons, 2017/18 to 2025/26, with the likely crop and confidence for each.Field NDVI by fortnight: 27 seasons, from Landsat to Sentinel-2, with the inferred crop for each.Likely crop 2025/26 in 30 m pixels around the field: soybean, wheat plus soybean, corn and non-agricultural.
  1. 2017/18 · first-crop soybean, medium confidence
  2. 2024/25 · wheat plus second-crop soybean
  3. Each season, with its confidence

What Ucotron does

  1. 1
    Pre-loads the fieldThe broker marks it and the area, the likely crop season by season and the storms of recent years appear.
  2. 2
    Checks prior damageYes, no or “can't be seen,” with the image. If a front passed through last night, the alert goes on before the policy is issued.
  3. 3
    Returns the data to your quoting toolThe rate and adjustment are set by the company; Ucotron delivers the data with its source.

Real engine example · a field in Pergamino

27seasons with inferred crop, 1999/00 to 2025/26
9seasons clipped in Sentinel-2, each with its confidence
30 mpixel of the likely crop of neighboring fields

We don't say “40 years of hail”: lightning starts in 2017 and the field's optical record in 1999. Each source, from the year it begins.

05Parametric

A parametric productwith an auditable trigger.

  • Insurers that want to launch one
  • Municipalities and provinces
  • Reinsurance

The pain

The rule requires reporting a “statistically representative” historical frequency that no one has standardized, measuring basis risk, and paying within 15 days of the event.

Res. SSN 315/2026 has been in force since Jul 23. According to the SSN agro survey, no insurer sold parametric products in 2024 or 2025.

Parametric file · ERA5 and Sentinel-1

Trigger frequency of the same index · hours with THI ≥ 79 · Rafaela

41 raw summers5 of 4112 %
Last 20 summers5 of 2025 %
41 summers, detrended19 of 4146 %

Same index, same threshold: frequency is a decision, not a data point. ERA5, 41 summers, our own calculation.

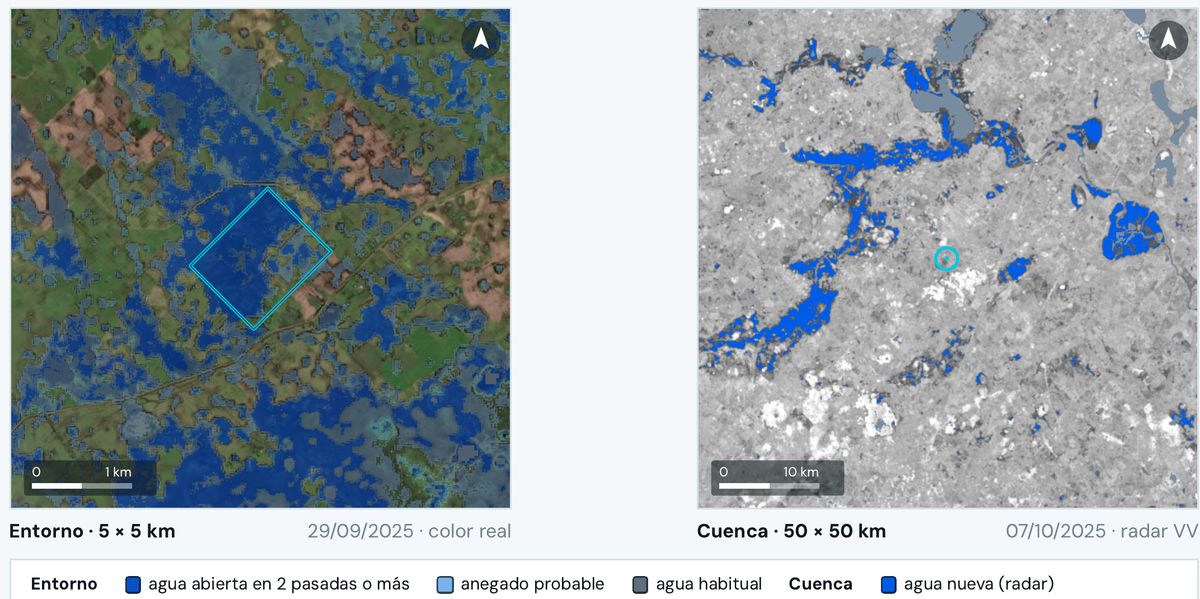
5 by 5 km surroundings and 50 by 50 km basin on Sentinel-1 radar, with new water in blue
The same heat index gives a trigger frequency of 12, 25 or 46% depending on the series: raw, last 20 years or trend-corrected.For an excess-water index: new water across a 50 × 50 km basin on Sentinel-1 radar, Oct 7, 2025.

What Ucotron does

  1. 1
    Builds the feasibility fileIndex, thresholds, frequency on several baselines and the alternative source.
  2. 2
    Measures basis riskHow far the index diverges from actual losses.
  3. 3
    Calculates each eventFreezes the data version and publishes it so a person decides the payout.

What we measured · heat on Rafaela dairy farms and excess water

×3the premium nearly triples depending on the series you pick
74 of 79cases in the flood golden set the detector gets right

We are not the actuary: the index, its history and its calculation ship with the source so an independent actuary can audit them.

06Claims and brokers

Excess water,field by field.

  • Claims
  • Underwriting in low-lying areas
  • Farmers in basins like the Salado

The pain

Under clouds there is no optical image, and no one tells event water from the lagoon that is there every year.

After more than 100 mm of rain over a basin, water claims arrive all at once and with no common measure.

Waterlogging assessment · Sentinel-1 and Sentinel-2
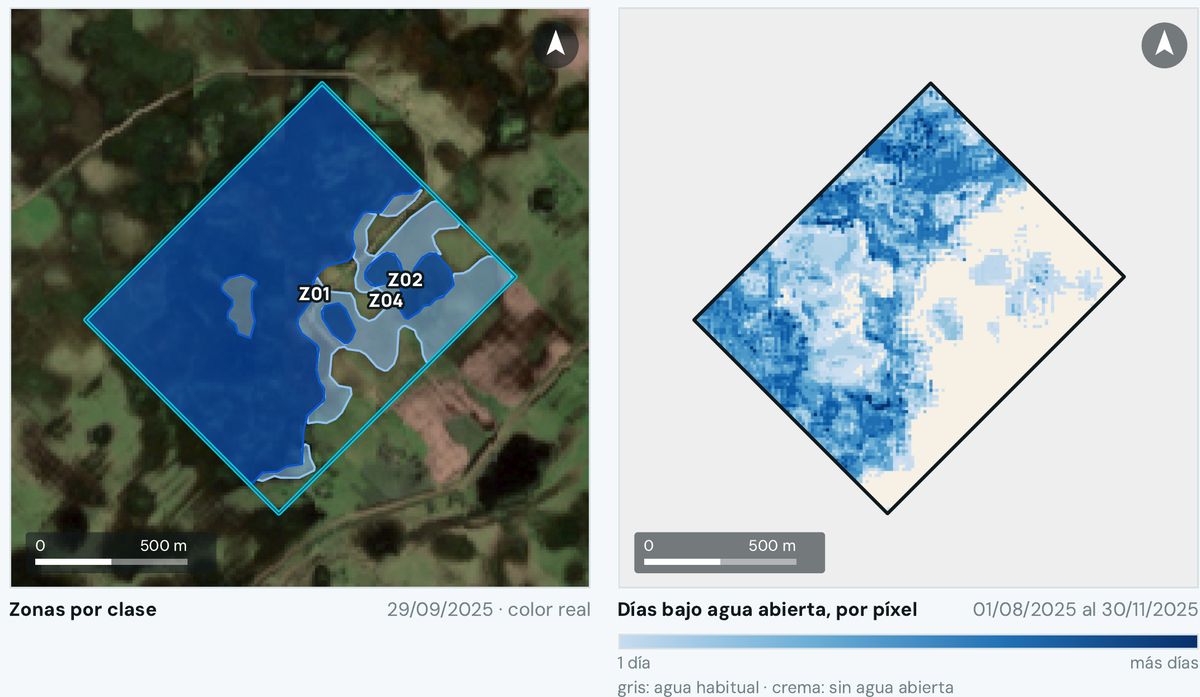
Water zones by class over true color and map of days under water per pixel
1Open water observed2Likely waterlogged: inferred, not seen3Days under open water, pixel by pixel
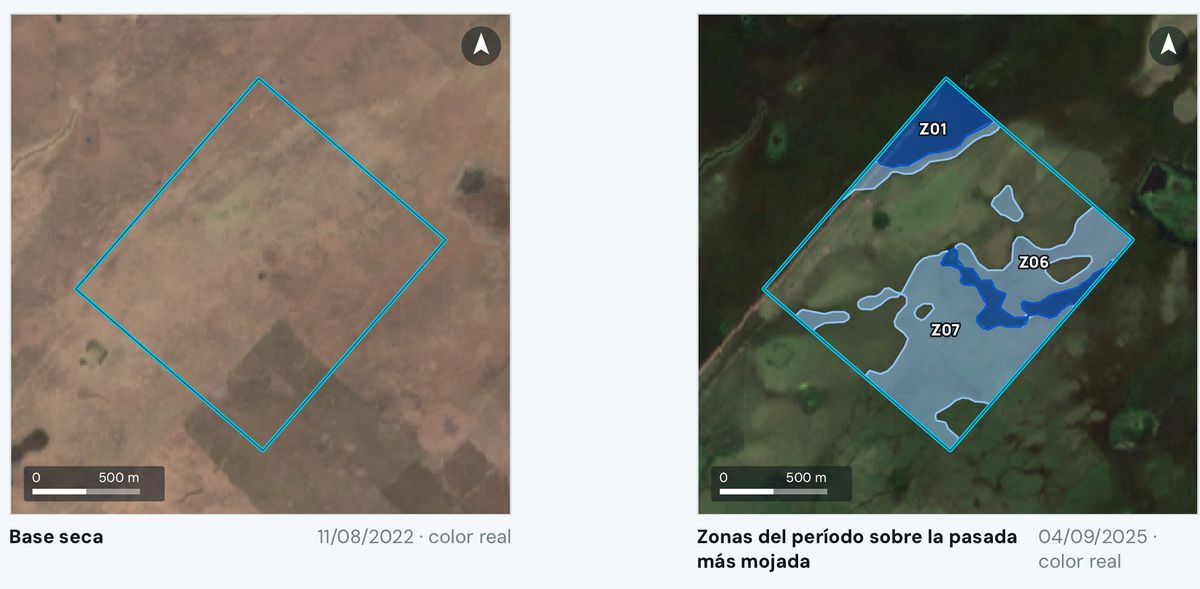
Field in Las Flores: 2022 dry baseline against the wettest 2025 pass
5 by 5 km surroundings and 50 by 50 km basin on radar, with new water in blue
General Belgrano: zones by class on Sep 29, 2025, and days under open water per pixel, Aug 1 to Nov 30, 2025.Las Flores: dry baseline of Aug 11, 2022 against the wettest pass, Sep 4, 2025.The field in its 5 × 5 km surroundings and in the 50 × 50 km basin, with new radar water in blue.
  1. Open water observed
  2. Likely waterlogged: inferred, not seen
  3. Days under open water, pixel by pixel

What Ucotron does

  1. 1
    Compares against a dry baselineEvery Sentinel-1 radar and Sentinel-2 optical pass, against the same place when dry.
  2. 2
    Separates what is seen from what is inferredObserved open water on one side, likely waterlogged on the other, and the days under water for each pixel.
  3. 3
    Puts the field in contextIts neighbors and the basin: whether everything around flooded or only that field.

Real engine examples · Salado Depression, August to November 2025

16.6 haof open water in Las Flores, 11% of the field, for at least 12 days
56.2 haof likely waterlogging in the same field
66.8 haunder water in General Belgrano, 68% of the field, for at least 37 days

In Las Flores there were 19 radar passes and 18 usable optical ones. The flood detector gets 74 of 79 golden-set cases right.

07Insurance brokers

The broker who alerts,quotes and files claims on WhatsApp.

  • Insurance brokers
  • Farmers, through their broker

The pain

The broker spends their time on paperwork; after a storm they don't know which clients were hit, and the farmer already has dozens of apps showing the same thing.

Insurance brokers are swamped with paperwork, and crop imagery is already a commodity: what matters is the alert under their name.

UcotronYour portfolio · after the hail

Hail passed over your portfolio last night. 3 clients are inside the swath: Client A (2 fields), Client B and Client C.GOES-19 GLM · 06:40

Show me Client A's field

The field before and after the hailstorm, with the greenness drop marked

Drop in greenness across almost the whole field. The signed report is ready.

I already spoke with him. File the claim.

Claim pre-filled with the report. Send it to the insurer?

Yes, send it

Sent with your OK. It's in the log.

What Ucotron does

  1. 1
    The list after the stormUcotron tells the broker which clients fell inside the swath.
  2. 2
    The alert, under their nameThe broker writes to their client and, if confirmed, gets the claim pre-filled with the signed report.
  3. 3
    Win clients with the field's historyA prospect receives “your field's history” with the broker's brand. The farmer asks on WhatsApp or from Claude or ChatGPT, and the answer comes with source and date.

The rule we measure

0claims sent without the broker's OK
Logevery step is logged, with who did it and when

08Claims

Electrical damage from lightning:was there a strike there, at that time?

  • Home, commercial and condo
  • Rural: sheds and livestock

The pain

The electrical damage claim is paid on what is declared, without checking whether there was a storm at that point and time.

Policies are underwritten on what is declared and paid on what is claimed: no one cross-checks the point and time against the lightning the satellite saw.

Lightning check · GOES GLM
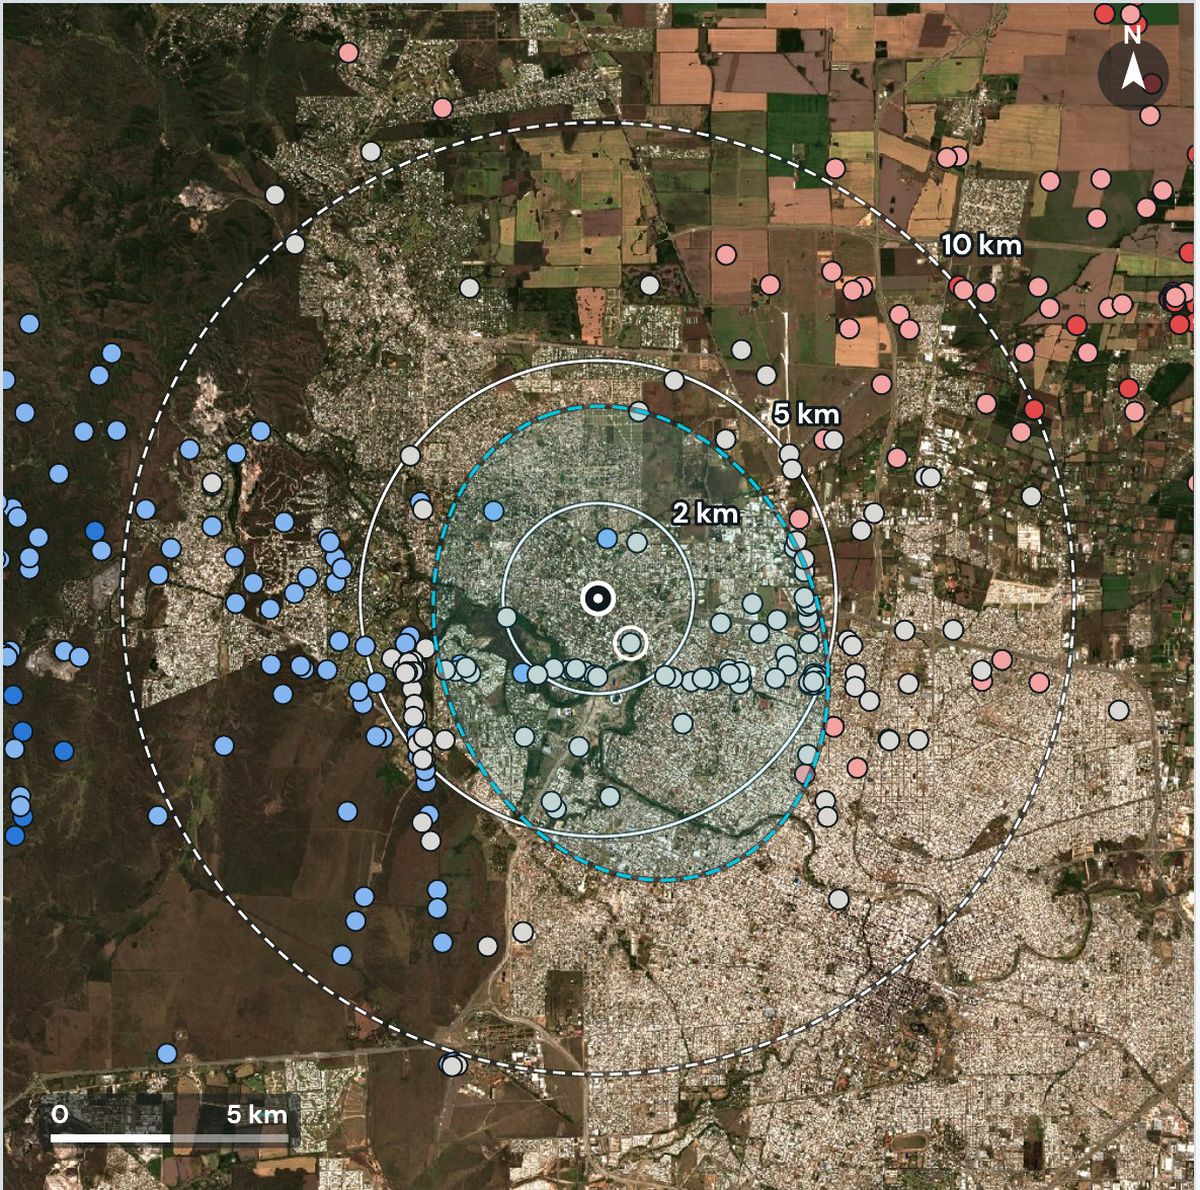
Lightning flashes around a point in Córdoba, with rings at 2, 5 and 10 km
1Declared point and time2Rings at 2, 5 and 10 km3Nearest flash: 1.2 km4Color: minutes from the declared time
Villa Belgrano: flashes around the declared point, colored by minutes before or after the time.
  1. Declared point and time
  2. Rings at 2, 5 and 10 km
  3. Nearest flash: 1.2 km
  4. Color: minutes from the declared time

What Ucotron does

  1. 1
    Takes the point and timeThe ones in the claim, with nothing else requested.
  2. 2
    Counts the flashesGLM at 2, 5 and 10 km, one hour before and after, and checks the cloud top.
  3. 3
    Issues a signed verdictConsistent, not consistent or inconclusive, with the flash map attached.

Real engine examples · real storms, demo claims

Consistent

136 flashes within 5 km; the nearest at 1.2 km.

Inconclusive

Nearest flash: 20.5 km from the declared time.

Not consistent

No flash within 30 km.

GLM detects 70 to 90% of flashes and doesn't say where a bolt hit the ground. That's why we say “consistent activity at 1.2 km,” not “lightning struck the house.”

What we don't promise

Every case has a limit.We say it up front.

Is your pain point different?Try it with one of your places.

You start with just the location: no portfolio, no integration.

Start for free

Leave your details and we'll open your account. We'll reach out to set up your first place.

No card, no commitment.